FIG 6.
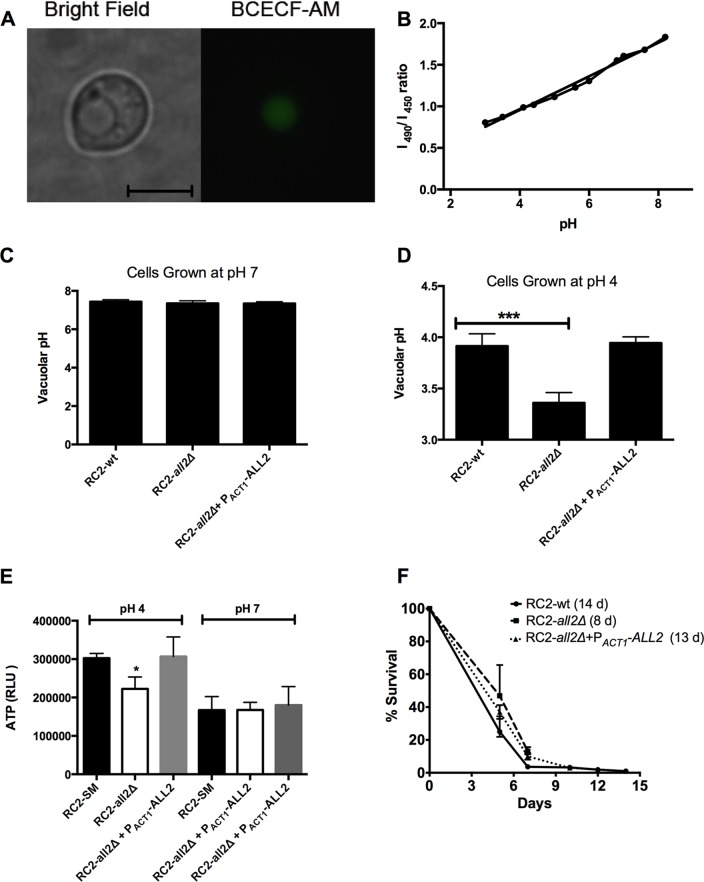
Intracellular pH measurement of C. neoformans RC2-wt and RC2-all2Δ cells. (A) BCECF-AM successfully stained vacuoles of C. neoformans (scale bar, 5 μm). (B) Calibration curves were generated using ratio of fluorescence intensity from excitation at 450 to 490 nm (both measured at an emission wavelength of 535 nm) at varied pH. The pHi were comparable in cells grown at pH 7 (C) and found to be significantly different between RC2-wt and RC2-all2Δ cells when grown in acidic pH conditions (D). (E) RC2-all2Δ mutant cells exhibited significantly less ATP production per μg of protein than RC2-wt cells at pH 4 but comparable levels at pH 7. (F) The CLS of RC2-wt cells was significantly longer than the CLS of all2Δ cells (14 versus 8 days, P < 0.001), as measured by survival in water. An asterisk denotes a P value of ≤0.05.

