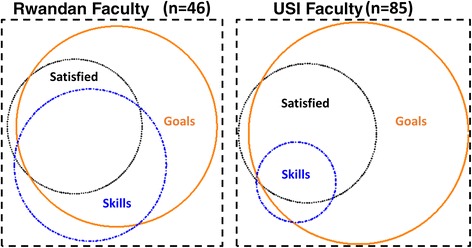
Fig. 2.

Magnitude of outcome variables and their overlap, by USI faculty and Rwandan faculty. The box represents 100 % of respondents who answered questions about all three outcomes. The size of the circle represents proportion reporting the outcome. The overlap in circles represents overlap in outcomes reported.
