
Fig. 2.
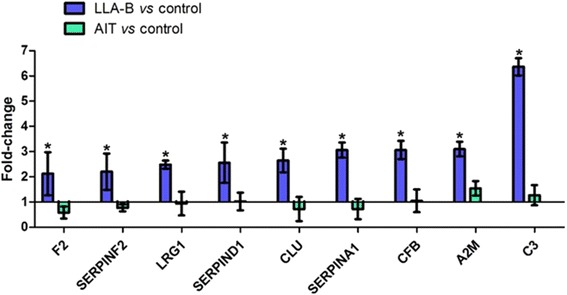
Panel of candidate protein biomarkers for B-ALL. Blue columns represent the expression levels of the proteins in B-ALL patients at the time of diagnosis in relation to the control. Green columns represent the expression levels of the proteins in B-ALL patients after induction therapy (day 35) relative to controls. (*) (p < 0.05)