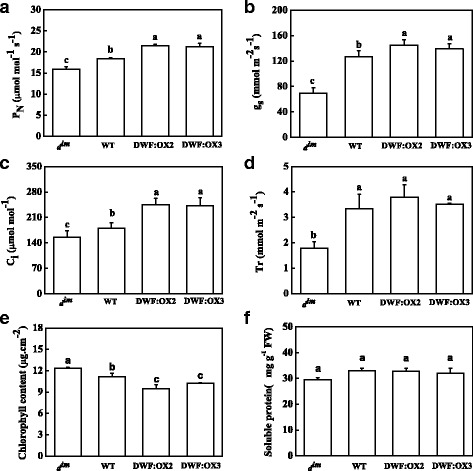
Fig. 2.

Effects of Dwarf gene overexpression (DWF:OX2 and DWF:OX3) and mutation (d im) on net photosynthetic rates (P N), (a), stomatal conductance (gs), (b), intercellular CO2 concentration (Ci), (c), transpiration rate (Tr), (d), total chlorophyll content (e) and soluble protein content (f). Data are the means of four replicates with SDs. Means followed by the same letter are not significantly different according to Tukey’s test (P < 0.05)
