
Fig. 3.
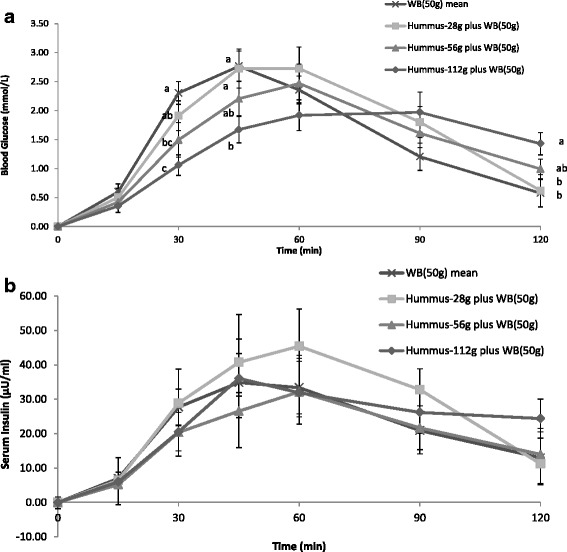
Incremental blood glucose (a) and insulin (b) responses after consumption of escalating doses of hummus (28 g, 56 g and 112 g) containing 2.7 g, 5.4 g and 10.8 g of available carbohydrate, respectively, plus white bread or white bread alone (WB50) containing 50 g of available carbohydrate. Values are expressed as Mean ± SEM. Bars not sharing a common letter are significantly different, P < 0.05