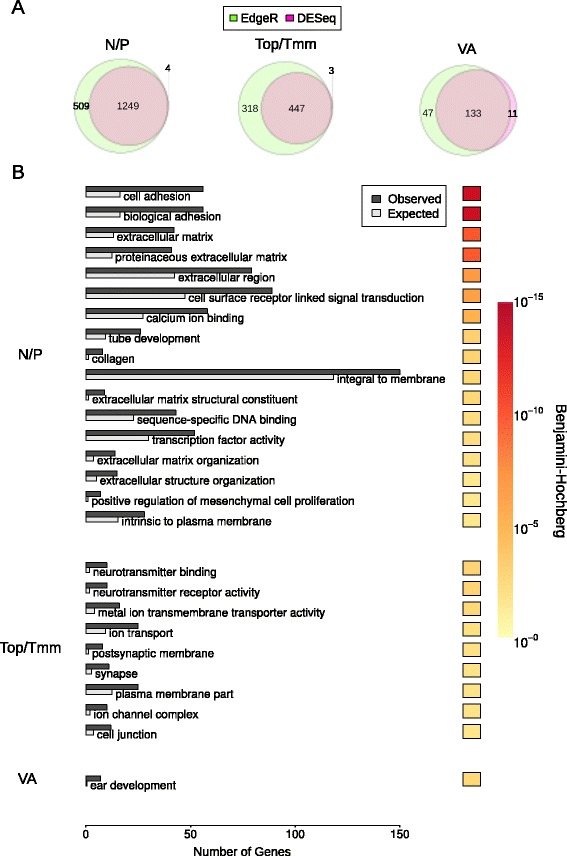
Fig. 3.

Genes differentially expressed in Nodose and Petrosal (N/P), Trigeminal ophthalmic and maxillomandibular (Top/Tmm) and Vestibulo-acoustic (VA) ganglia. A Number of differentially expressed genes (q < 0.05) reported by DESeq and EdgeR. B Significant Gene Ontology (q < 0.05) enrichment for differentially expressed genes reported by both DESeq and EdgeR. Redundant GO terms were removed using REVIGO. The Hinton plot displays the FDR (Benjamini and Hochberg) corrected q-value
