
Fig. 1.
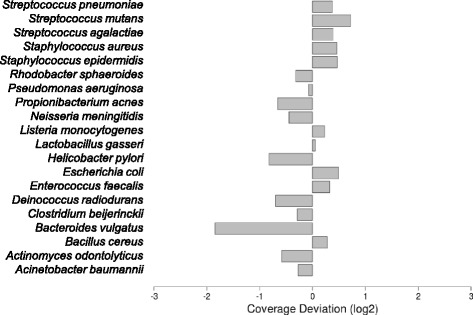
Species abundance in the mock community detected by MinION™. Species coverage was calculated by obtaining the fold-change (Log2) of species-specific read counting against the expected average for the entire community. A coverage bias was assumed when coverage deviation was lower than −1 or higher than 1