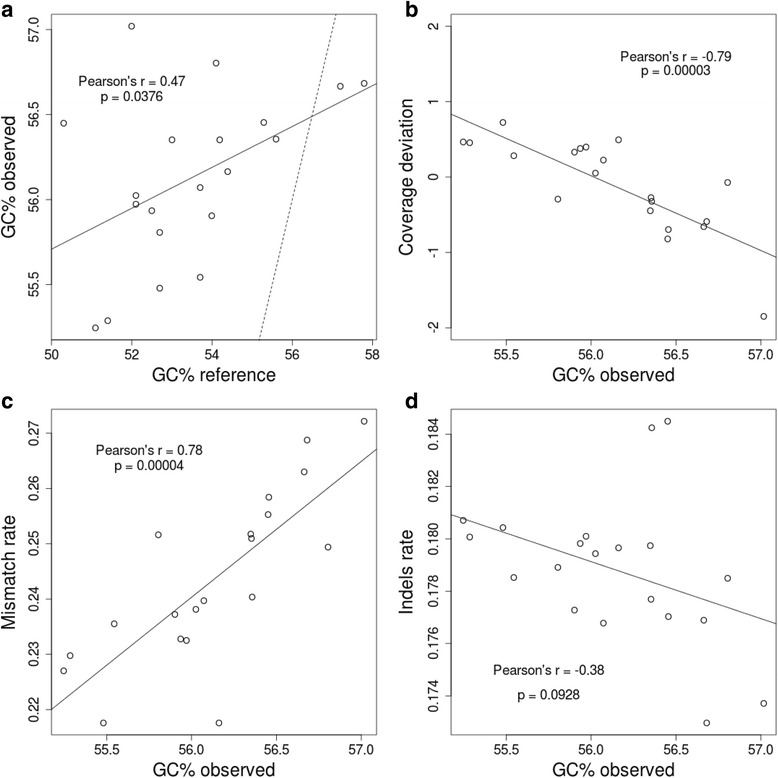
Fig. 3.

Per-base accuracy of the mapped reads. a Scatter plot of the GC content observed in mapped reads against the GC obtained from the reference sequences. The dashed line indicates a correlation with Pearson’s r = 1. b Correlation between the GC content observed in mapped reads and coverage bias observed in Fig. 1. c Influence of the GC content observed in mapped reads on mismatch rates calculated after mapping. d Scatter plot of the observed GC content of mapped reads and indel rates calculated after mapping. In all cases the Pearson’s r coefficients and p values supporting such correlations are presented inside the scatter plots and solid lines indicate the tendency of correlations
