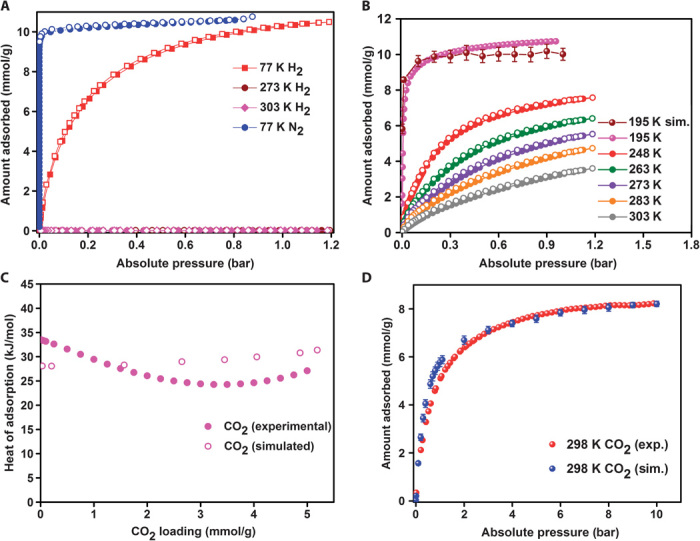
Fig. 2. Experimental and simulated adsorption isotherms and HOA plots.

(A) Experimental H2 and N2 isotherms. (B) CO2 adsorption isotherms carried out on 1 at different temperatures (filled circles, adsorption; open circles, desorption). For CO2 at 195 K, the simulated adsorption isotherm is shown. (C) HOA for CO2 in 1 as a function of the CO2 loading determined from a virial fit to isotherms collected at temperatures ranging from −25° to 30°C. HOA determined from GCMC simulations at 25°C are also shown. (D) Experimental and simulated gas adsorption isotherms for CO2 at 298 K (0 to 10 bar).
