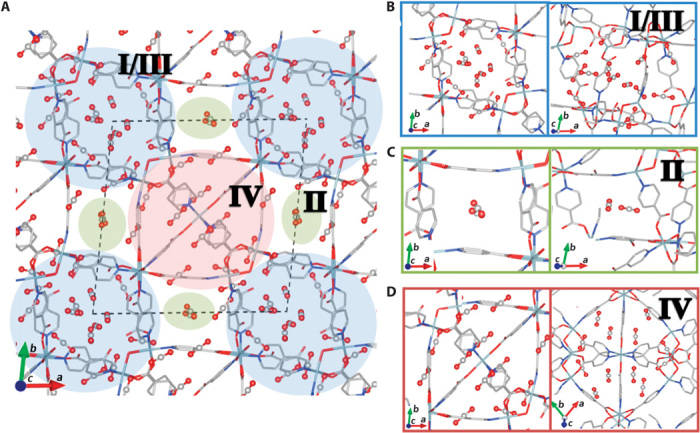
Fig. 3. CO2 binding sites modeled from simulations.

(A) A view looking down the c axis of 1 showing the top 30 CO2 binding sites determined from a GCMC simulation at 195 K and 1 bar. There are three distinct binding regions noted in blue (I/III), green (II), and red (IV). Binding region I/III corresponds to the 2D channels depicted in Fig. 1B. Binding region II corresponds to the 1D channels labeled II in Fig. 1B. IV corresponds to the near-spherical cage. (B to D) Close-ups and different views of binding regions. (B) I/III. (C) II. (D) IV.
