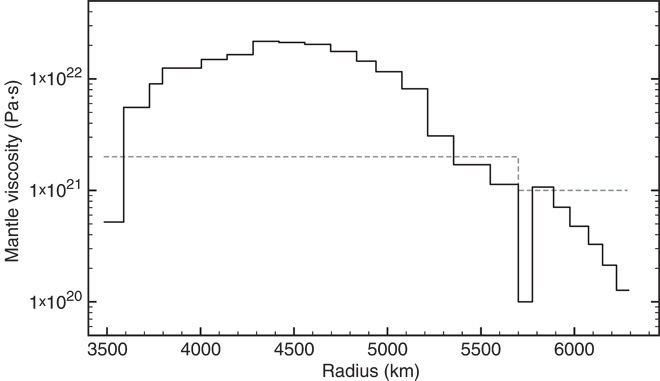
Fig. 2. Mantle viscosity profiles adopted in this study.

The dashed gray line and the solid black line represent the VM1 (13, 14) and MF (26) radial profiles of viscosity from the base of the lithosphere to the CMB. The former has a viscosity jump of a factor of 2 at the 670-km boundary between the upper mantle and the lower mantle. The latter (a 23-layer model) is characterized by an increase in viscosity of greater than two orders of magnitude from the base of the lithosphere to the deep mantle and is consistent with inferences based on observations related to both GIA (24–26) and mantle convection (27–31).
