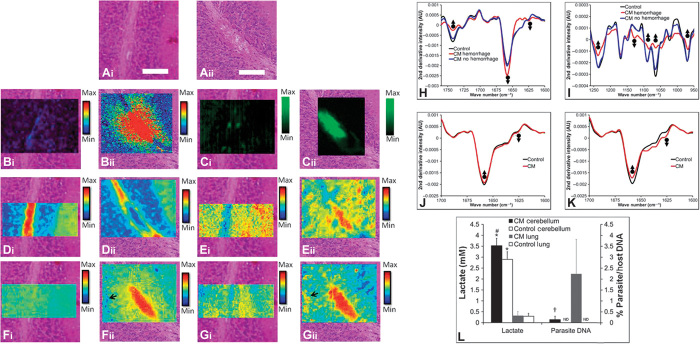
Fig. 2. Multimodal biospectroscopic approach to studying the biochemical mechanisms of CM.
(A to G) Biospectroscopic imaging in combination with histology of cerebellum tissue in CM and control mice. (A) Representative example of H&E histology of cerebellum tissue from control (i) and CM (ii) mice, highlighting the appearance of tissue edema at the site of vascular hemorrhage. (B) XFM elemental mapping of the distribution of Fe in control (i) and surrounding hemorrhaged tissue in CM (ii) cerebellum tissue. (C) Resonance Raman mapping of the distribution of hemoglobin in control (i) and hemorrhaged tissue in CM (ii) cerebellum tissue. (D) FTIR imaging of the lipid (second-derivative band intensity at 1742 cm−1) distribution in control (i) and hemorrhaged tissue in CM (ii) cerebellum tissue. (E) FTIR imaging of the lactate (second-derivative band intensity at 1127 cm−1) distribution in control (i) and hemorrhaged tissue in CM (ii) cerebellum tissue. (F) FTIR imaging of the α helix protein (second-derivative band intensity at 1656 cm−1) distribution in control (i) and hemorrhaged tissue in CM (ii) cerebellum tissue. (G) FTIR imaging of the aggregated β sheet protein (second-derivative band intensity at 1627 cm−1) distribution in control (i) and hemorrhaged tissue in CM (ii) cerebellum tissue. Black arrows in (Fii) and (Gii) highlight the location of elevated aggregated β sheet/α helix protein ratio hotspots. Scale bar in (A), 50 μm. (H to K) Representative second derivatives of the average FTIR spectra from control and CM mouse cerebellum tissue. (H) Lipid and protein alterations in the spectra from hemorrhaged and nonhemorrhaged inner white matter from CM mice and from inner white matter of control mice. AU, arbitrary units. (I) Differences in lactate in the spectra from hemorrhaged and nonhemorrhaged inner white matter from CM mice and from inner white matter of control mice. (J) Protein alterations in the spectra from granular layer tissue in CM mice and control mice. (K) Protein alterations in aggregated protein “hotspots” in the spectra from granular layer tissue of CM and control mice. Upward-facing arrows highlight spectral locations of decreased second-derivative band intensity, and downward facing arrows highlight spectral locations of increased second-derivative band intensity. (L) Brain and lung lactate levels in CM diseased and control mice (n = 5). Parasite DNA was not detected (ND) in the brain or lung of control mice. #Significant difference in brain lactate between CM and control mice. *Significant difference in lactate between the brain and lung of CM mice, or between the brain and lung of control mice. †Significant difference in parasite DNA between the brain and lung of CM mice.

