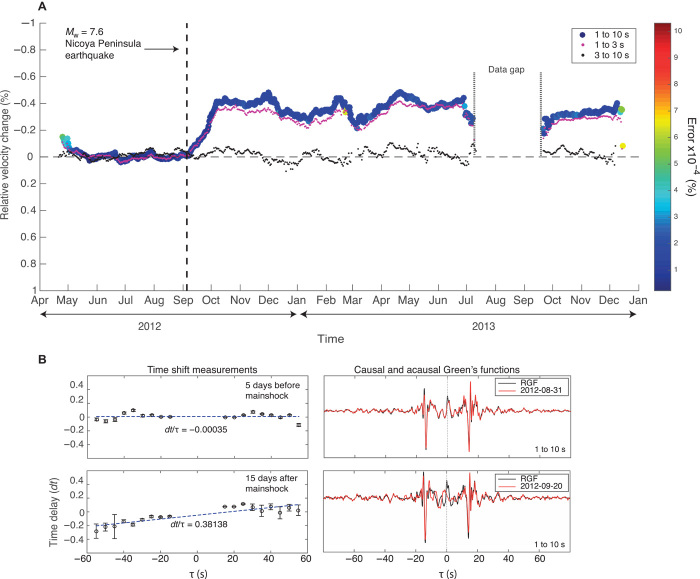
Fig. 3. Seismic velocity reductions, GFs, and time delays associated with the 2012 Nicoya Peninsula earthquake for the station pair INDI-SAJU in the following period bands: 1 to 10, 1 to 3, and 3 to 10 s.
(A) The preseismic, coseismic, and postseismic velocity variations between April 2012 and October 2013. The dashed line indicates the time of the mainshock. Note the near-identical velocity reduction in the 1- to 10-s and 1- to 3-s period bands and the lack of a velocity variation in the 3- to 10-s band. (B) RGF, daily GFs, and time delays resulting from the cross-correlation of their coda filtered between 1 and 10 s: 5 days before and 15 days after the earthquake. The longer time period used after the earthquake was required to avoid mixing of postseismic signals or aftershocks.

