
Figure 2. Cell cycle analysis of γ-irradiated HepG2 cells.
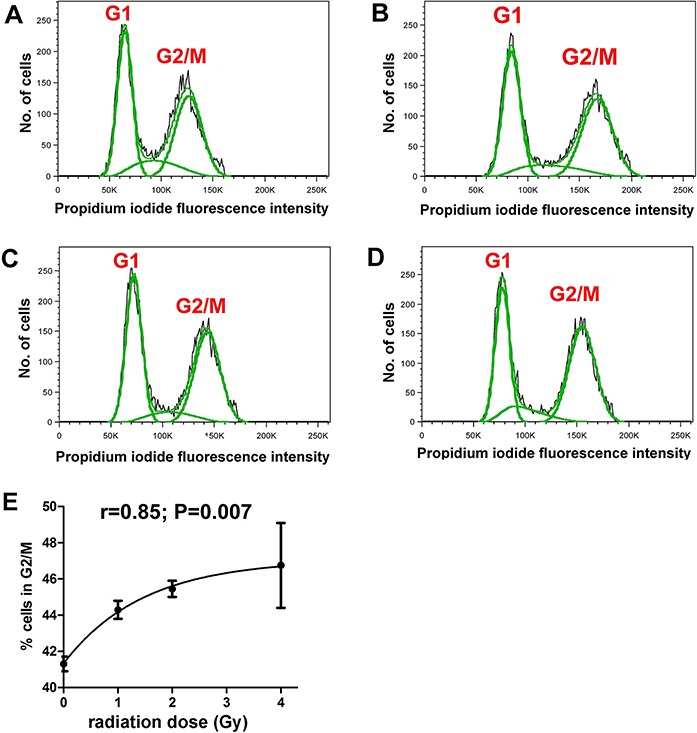
Flow cytometry of HepG2 cells after different doses of γ-irradiation. (A) Sham irradiated. (B) 1 Gy irradiation. (C) 2 Gy irradiated. (D) 4 Gy irradiated. (E) Relationship between radiation dose (Gy) and proportion of cells in G2/M. There occurs a slight and saturable shift from G1 to G2/M with increasing dose of γ-irradiation.