
Figure 4. Metabolomic analysis on lysates of γ-irradiated HepG2 cells.
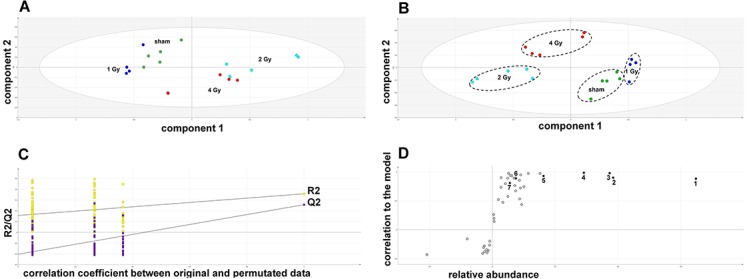
(A) Unsupervised principal components analysis (PCA) scores plot showing separation of the sham irradiated (green symbols), 1 Gy γ-irradiated samples (blue symbols), the 2 Gy γ-irradiated (turquoise symbols) and 4 Gy γ-irradiated samples (red symbols). There was one outlier from the Hotelling’s T2 ellipse (95% confidence interval), belonging to the 1 Gy group, which has been removed. (B) Supervised projection to latent structures-discriminant analysis (PLS-DA) scores plot showing a clear separation of the sham, 1 Gy, 2 Gy and 4 Gy γ-irradiated samples. (C) Validation of the PLS-DA model using 100 iterations. The data are not over-modelled because the correlation coefficient (R2) fell below 0.3 and the predictability coefficient (Q2) fell below zero after data permutation. (D) Orthogonal PLS-DA (OPLS-DA) loadings S-plot for sham versus 2 Gy γ-irradiation of HepG2 cells. Each symbol represents a metabolite and its contribution to the separation between sham and 2 Gy γ-irradiated samples in panel B. Filled symbols are those metabolites selected for univariate statistical analysis. 1 = D-glucose; 2 = L-lactate; 3 = L-5-oxoproline; 4 = L-alanine; 5 = D-fructose; 6 = D-glucose 6-phosphate; 7 = succinate.