
Figure 7. Univariate data analysis on metabolomic markers of γ-irradiated HMCL-7304.
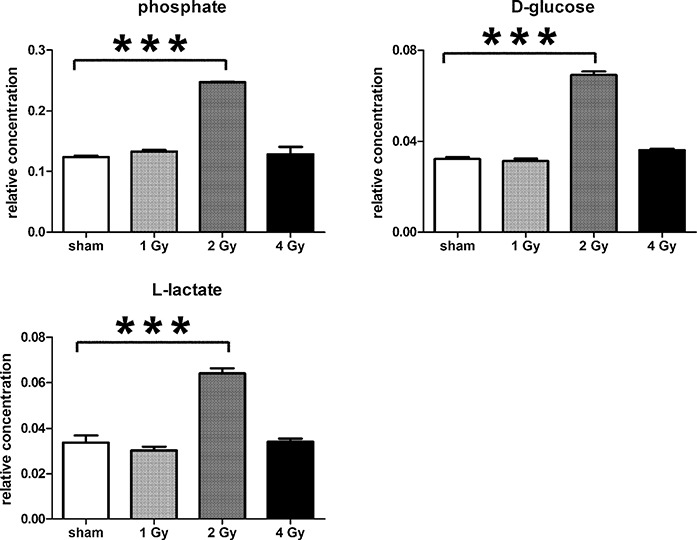
Data are presented as means ± S.D. Data were analyzed by one-way ANOVA for each metabolite with Bonferroni’s correction for multiple comparisons. ANOVA was significant at P < 0.0001. There were no statistically significant differences between the sham irradiated and either the 1 Gy γ-irradiated or 4 Gy γ-irradiated samples for any metabolite. *** means P < 0.001. Relative concentrations were calculated as the peak area of each metabolite divided by the peak area of the internal standard and are based upon 4 × 10⁶ cells.