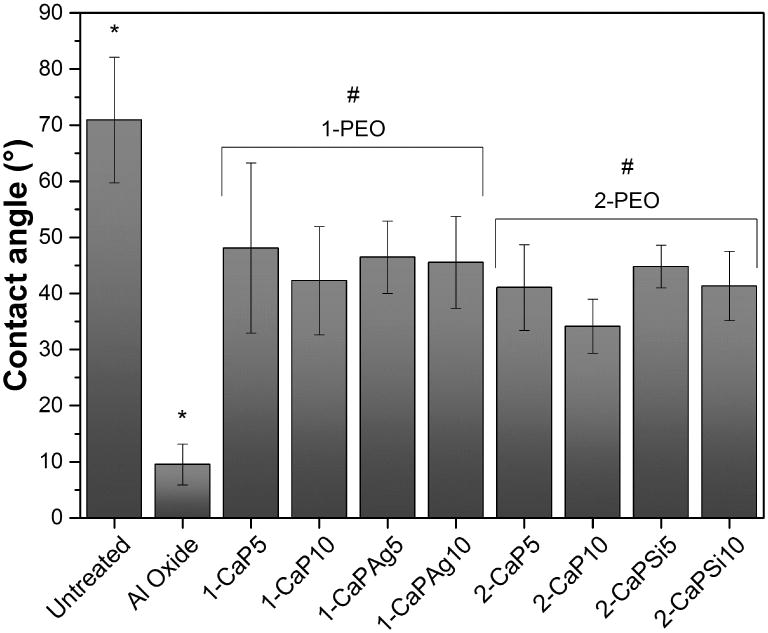
Figure 7.

WCA of all groups, controls and PEO treated. #Indicates significant difference for 1-PEO and 2-PEO when compared to untreated and al oxide groups (p<.05). *Indicates a statistically significant difference of p<.001 when compared to all groups.
