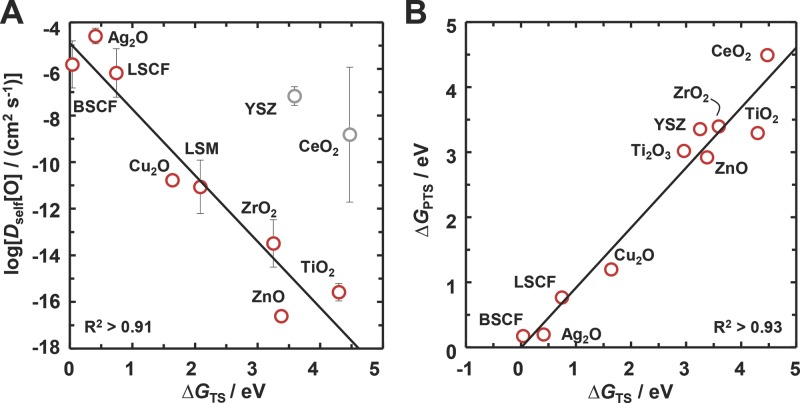
Figure 6.
Modeling the kinetics of the oxygen-vacancy conduction. A) The average oxygen self-diffusion constant at 771 ± 36 °C for TiO2,26–28 LSM,29,30 BSCF,31 LSCF,29,32 Cu2O (extrapolated),33 ZnO,34,35 ZrO2,26,36 YSZ,26,36–39 Ag2O,40–42 and CeO237,43,44 versus the free energy of the transition state, ΔGTS. One standard deviation is shown with error bars. The solid line is a linear regression (without YSZ and CeO2). Details are given in Supporting Information. B) Correlation the pseudotransition-state energy for the oxygen-vacancy conduction, ΔGPTS, with ΔGTS. The solid line is a linear regression.

