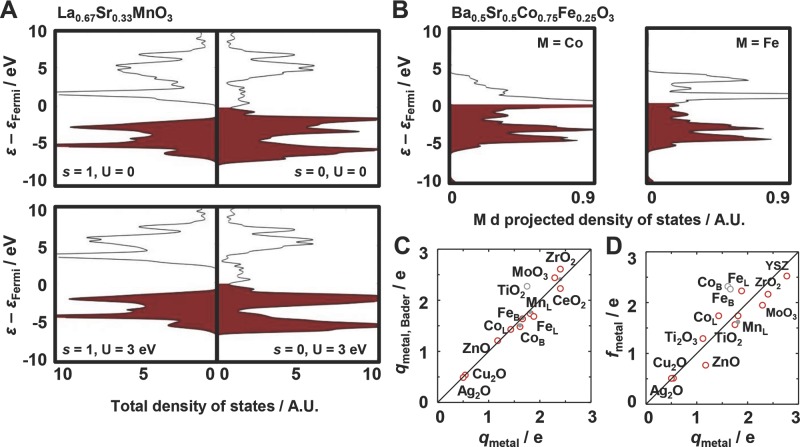
Figure 8.
Testing the sensitivity to the Hubbard U. DOS plots for A) LSM and B) BSCF perovskite bulk structure that show the materials-specific physical properties reported in the literature. C) The partial average charge of the metal atom computed via the Bader method and D) the fractional band filling versus the charge of the metal cations as reported in the literature (mostly Bader charges) for TiO2,80 Ti2O3,81 Mn in LSM (MnL),79 Fe in BSCF (FeB),82 Fe in LSCF (FeL),69 Co in BSCF (CoB),82 Co in LSCF (CoL),69 Cu2O,83 ZnO,84 ZrO2,85 YSZ,85,86 MoO3,87 Ag2O,88 and CeO2.89 Empty light gray circles mark data points that deviate by more than C) 0.20 or D) 0.35 e from parity (solid line); filled circles mark computations with U > 0.

