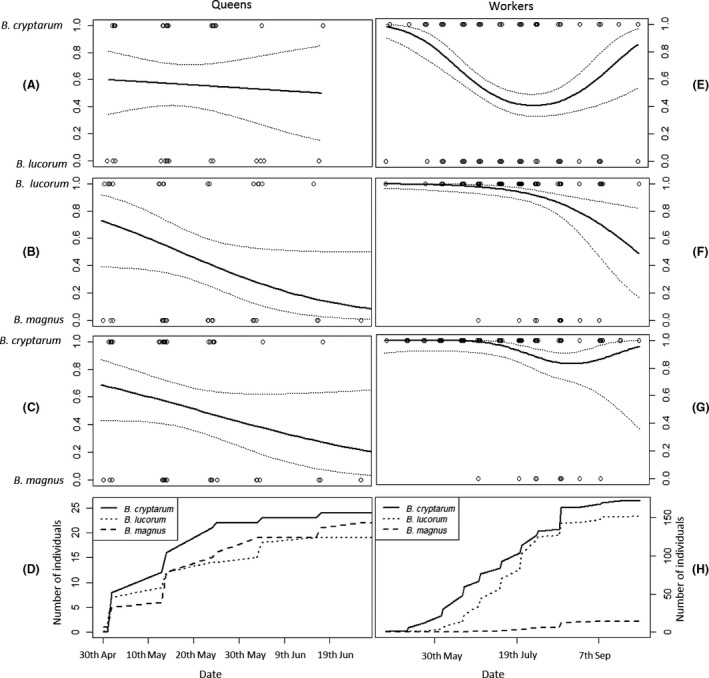
Figure 2.

Interspecific variation in phenology of queens (A–D) and workers (E–H) of the lucorum complex species. Panels show the changes in the probability of an individuals belonging to the following: B. cryptarum compared to B. lucorum (A & E), B. lucorum compared to B. magnus (B & F), and B. cryptarum compared to B. magnus (C & G) as a function of date. The relative abundance of species pairs changed significantly through the season for all comparisons except for between B. cryptarum and B. lucorum queens (A; see S. 7). Trend lines are model fits from generalised linear models representing quadratic relationships in (E & G) and linear relationships in (B, C & F); 95% confidence intervals are shown around these relationships. Panels D & H show how the cumulative abundance of overwintered queens (D) and workers (H) shifted through the season for each bumblebee species.
