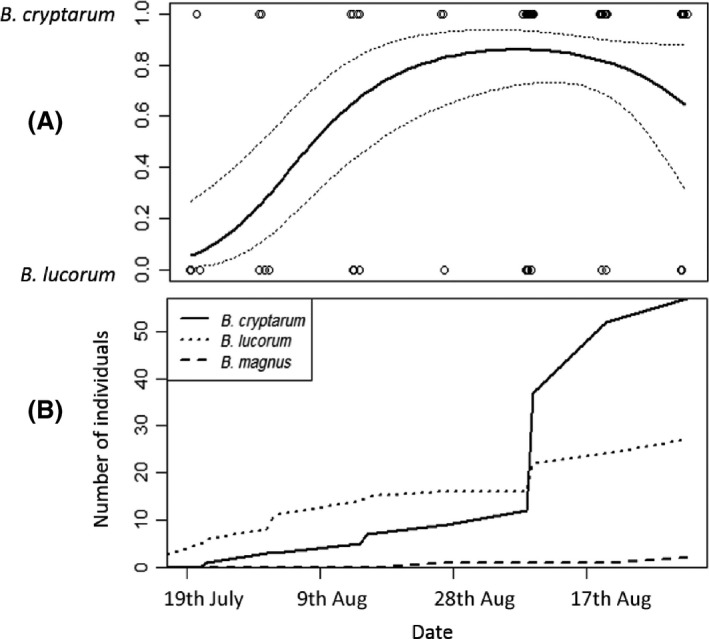
Figure 3.

Interspecific variation in phenology of males of B. cryptarum, B. lucorum and B. magnus. (A) the probability that a male belonged to either B. cryptarum or B. lucorum changed significantly through the season. The trend line shows a quadratic relationship fit from a generalised linear model with 95% confidence intervals. The numbers of B. magnus males were too low to perform this analysis. (B) Changes in the cumulative number of males of each of the three bumblebee species over the season.
