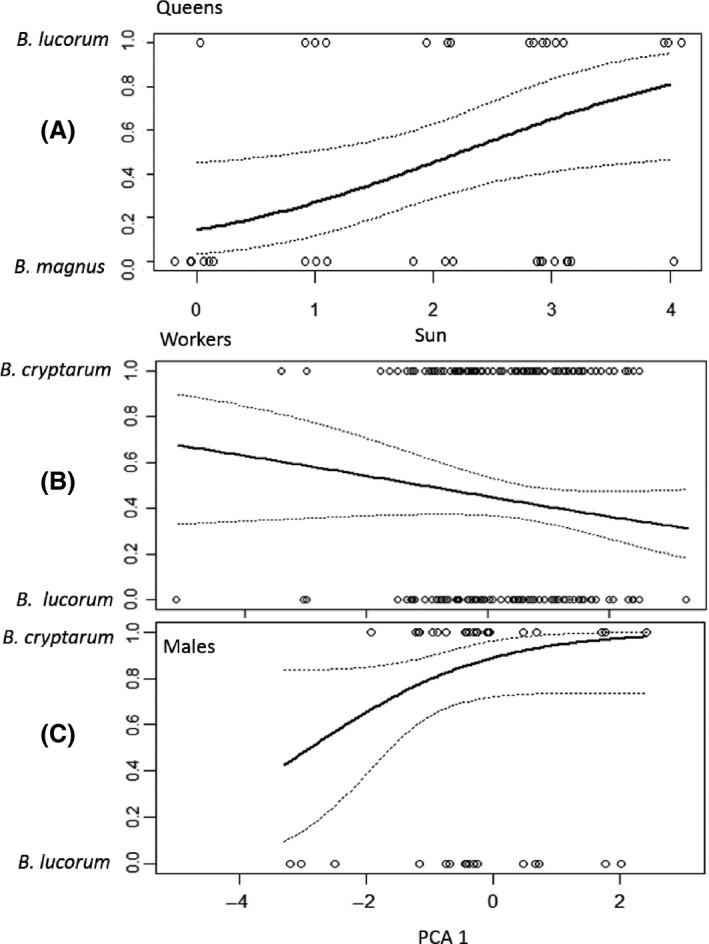
Figure 4.

Differences in the effects of weather variables on the activity of lucorum complex species. (A) The level of sunshine differentially affected the abundance of queens of B. lucorum and B. magnus: The sun axis represents a scale ranging from 0 (heavy complete cloud cover) to 4 (<25% cloud cover; see Table S1). In (B & C), PCA 1 represents a scale where low values indicate cool cloudy conditions and higher values indicate warmer, sunnier conditions (see Fig. S4): Figures display the relative impact of changes in this weather axis on the activity of workers (B) and males (C) of B. cryptarum compared to B. lucorum. Trend lines are model fits from a generalised linear model with 95% confidence intervals.
