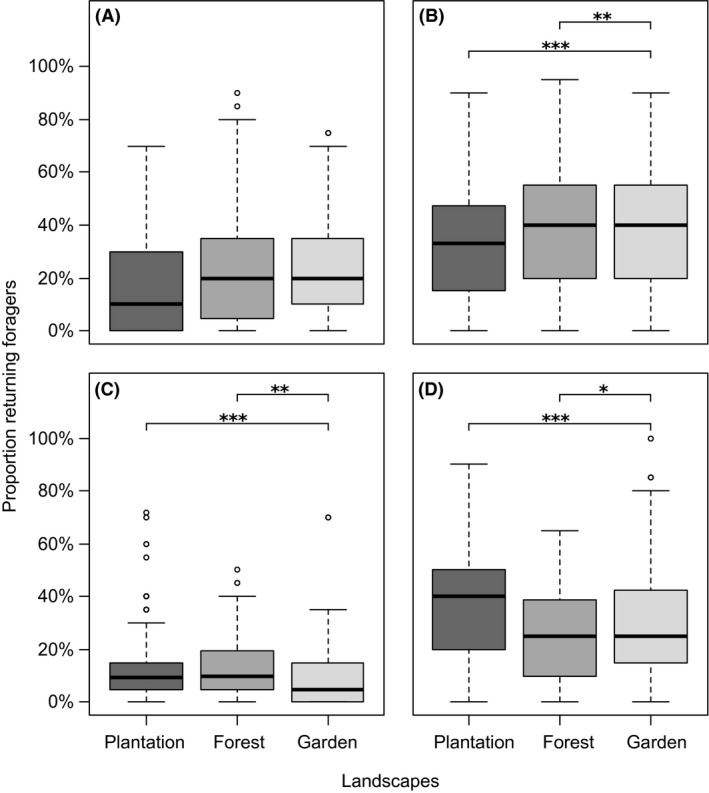
Figure 3.

Proportional resource intake in plantations (dark gray bars), forests (gray) and gardens (light gray). Shown are per cent of foragers returning with (A) pollen, (B) nectar, (C) resin, and (D) unsuccessful foragers. Boxplots display the median (thick bar), lower (0.25) and upper (0.75) quartile (gray box), minimum and maximum values (whiskers) and outliers of each dataset. Asterisks indicate significant differences between landscapes according to Tukey's posthoc test, significance levels as follows: *P < 0.05, **P < 0.01, ***P < 0.001.
