
Fig. 1. The global shape analysis (GSA) Pipeline workflow and a 3D scene output.
The global shape analysis (GSA) Pipeline workflow and one example of a 3D scene output file indicating statistically significant (p-value < 0.05) volumetric differences between the AD, MCI and NC cohorts. These scene files are generated for each group comparison and each shape or volume metric.
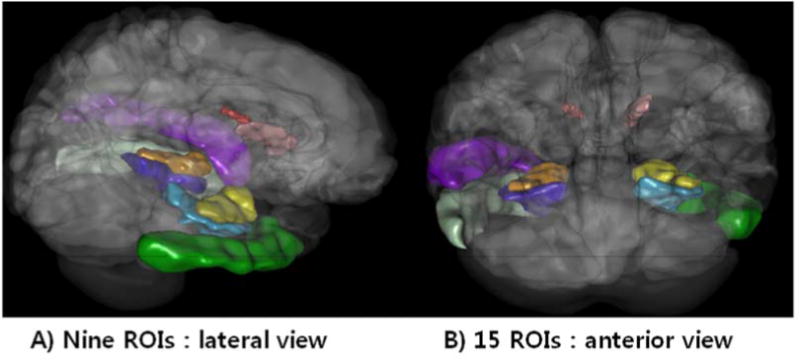
#Nine ROIs in this 3D scene [The volume and shape measures] for the associations of the top 20 most significant biomarkers among 80*80 measures: R_hippocampus, L_hippocampus, R_inferior_temporal_gyrus, L_inferior_temporal_gyrus, R_parahippocampal_gyrus, L_parahippocampal_gyrus, R_caudate, L_caudate, L_superior_temporal_gyrus