Abstract
Objective:
Visceral adipose tissue (VAT) is a significant risk factor for obesity-related metabolic diseases. This study investigates (1) the best single CT slice location for predicting total abdominal VAT volume in paediatrics and (2) the relationship between waist circumference (WC), sagittal diameter (SD), gender and VAT volume.
Methods:
A random sample of 130 paediatric abdomen CT scans, stratified according to age and gender, was collected. Three readers measured VAT area at each intervertebral level between T12 and S1 using ImageJ analysis (National Institute of Health, Bethesda, MD) software by thresholding −190 to −30 HU and manually segmenting VAT. Single-slice VAT measurements were correlated with total VAT volume to identify the most representative slice. WC and SD were measured at L3–L4 and L4–L5 slices, respectively. Regression analysis was used to evaluate WC, SD and gender as VAT volume predictors.
Results:
Interviewer and intraviewer reliability were excellent (intraclass correlation coefficient = 0.99). Although VAT measured at multiple slices correlated strongly with abdominal VAT, only one slice in females at L2–L3 and two slices in males at L1–L2 and L5–S1 were strongly correlated across all age groups. Linear regression analysis showed that WC was strongly correlated with VAT volume (beta = 0.970, p < 0.001).
Conclusion:
Single-slice VAT measurements are highly reproducible. Measurements performed at L2–L3 in females and L1–L2 or L5–S1 in males were most representative of VAT. WC is indicative of VAT.
Advances in knowledge:
VAT should be measured at L2–L3 in female children and at either L1–L2 or L5–S1 in males. WC is a strong indicator of VAT in children.
INTRODUCTION
The prevalence of obesity has increased dramatically over the past 30 years and was recently described by the World Health Organization as a “global epidemic”.1 In 1980, 7% of children aged 6–11 years were obese compared with nearly 18% in 2012. Similarly, the percentage of adolescents aged 12–19 years who were obese increased from 5% to almost 21% over the same period.2 The Centers for Disease Control (CDC) and Prevention classifies overweight children as those with a body mass index (BMI) over the 85th percentile and obese children as those with BMI over the 95th percentile relative to a child's age and sex. Currently, more than one-third of children and adolescents are overweight or obese, related to the sex-specific CDC BMI-for-age growth charts from 2000.3
Abdominal obesity in particular is highly prevalent in children.4 Abdominal adipose tissue can be categorized as subcutaneous adipose tissue (SAT) or visceral adipose tissue (VAT) based on its location in the abdomen.5 VAT surrounds internal organs in the abdominal cavity.5 Excessive VAT is a significant risk factor for insulin resistance,6,7 metabolic syndrome,8 cardiovascular disease9,10 and diabetes.4,11,12 VAT is related to these medical conditions through blood drainage, hormonal factors, inflammation and adipocytokines.11 Quantifying VAT in children will enhance understanding between fat distribution and health risk12 and should help identify children at elevated health risk.
MRI and CT are typically used to quantify VAT in vivo as they enable the visualization and quantification of adipose tissue in different compartments.13 It has been suggested that the gold standard measurement protocol is contiguous CT images from T10–T11 to L5–S1, but owing to time and radiation exposure, measurements are typically performed on a single CT image at L4–L5 or at the level of the umbilicus.14–16 Growing evidence suggests that this may not be the most suitable slice location and that a slice ≥5 cm above L4–L5 should be used for VAT measurement in adults.17,18 The single-slice location for VAT quantification used in adults may not be applicable to paediatric patients owing to the varying patterns of fat distribution between children and adults.
Only two studies have researched the best single-slice location in children, each with different recommendations. One study found that VAT measurements 5 cm (R2 = 0.93) and 10 cm (R2 = 0.93) above L4–L5 best correlated with overall abdominal VAT mass (p < 0.05) in white American children (N = 54).19 VAT measurements at specific anatomical landmarks (L1–L2, L2–L3, L3–L4 etc.) were not assessed. The second study found that VAT measurements obtained at the level of the umbilicus showed excellent correlation with overall VAT volume on a retrospective sample of 21 children, aged 8–14 years (r = 0.96, p < 0.001).20 Owing to small sample sizes and conflicting recommendations from these studies, further research is warranted to decide which single-slice location should be used when measuring VAT.
Growth and gender also influence adipose tissue distribution patterns in children, e.g. VAT generally increases at a more rapid rate than abdominal SAT from the age of 8 years. Adolescent boys preferentially deposit fat in the intra-abdominal region, whereas adolescent girls deposit more total fat in the subcutaneous region.14 The impact of gender and age on single-slice VAT measurements has not yet been investigated.
Adipose tissue can be measured in several ways that do not involve diagnostic imaging: measurement of BMI, waist circumference (WC) and waist : hip ratio, waist : height ratio, sagittal diameter (SD) or medical imaging. Anthropometric measurements are non-invasive, easy, quick and cheap to perform.21 Studies15,22 have shown that BMI measures and waist : height ratios are not associated with VAT and, therefore, should not be used as VAT measures. The correlation between WC, SD and abdominal VAT volume has not yet been established in a paediatric population.
This study investigates (1) the best single CT slice location for predicting total abdominal VAT volume in paediatrics and (2) the relationship between WC, SD, gender and VAT volume.
METHODS AND MATERIALS
With ethical permission, 130 abdomen CT scans were retrieved retrospectively from the picture archiving and communication systems (PACS) of paediatric hospitals in Ireland (2010–14), via a random stratified sampling, according to age and gender. A cohort of 148 abdomen CT scans was deemed suitable based on our inclusion criteria outlined here. The cohort was stratified into groups of 0–3, 3–6, 6–9, 9–12, 12–16 years for males and females separately. 13 examination accession numbers from each subgroup were randomly selected using Microsoft® Excel® (Microsoft, Redmond, WA). Radiologist reports accompanying each scan were reviewed. Subjects with intra-abdominal abnormalities affecting fat distribution, WC and SD measurements were excluded. Subjects with WC greater than the field of view were also excluded from the study. BMI was not recorded on RIS-PACS, but the obesity status of subjects was later determined by measuring the WC and comparing this measurement to the WC measurement of an obese child in the same age group. WC measurements of obese children in several age groups have been established by the Irish Universities Nutrition Alliance.23,24 In analysing the obesity status of patients included in this retrospective study, WC measurements equal or greater than the Irish Universities Nutrition Alliance obese WC measurements were considered obese. Repeat CT examinations for individual children were excluded as their measurements were already included. All children included in this study were of Caucasian ethnicity.
All examinations were performed on a Phillips Brilliance 64-slice scanner (Philips, Cleveland, OH) using the imaging protocols seen in Table 1. These weight-based scanning protocols differed in terms of kilovoltage peak with 80 kVp used for patients <40 kg, 100 kVp for 40- to 60-kg patients and 120 kVp for patients >60 kg in weight. Automatic exposure control was used for all patients >20 kg in weight. Each scan included the entire abdomen from the diaphragm to the symphysis pubis.
Table 1.
CT abdominal imaging protocols
| Patient | Scan protocol |
|---|---|
| Paediatric abdomen (kg) | |
| 0–20 | Helical scan, 80 kVp, 50 mAs, detector collimation 64 × 0.625 mm, rotation time 0.5 s, slice thickness 3 mm, pitch 0.891 and iDose level 4 iterative reconstruction |
| 20–40 | Helical scan, 80 kVp, DoseRight AEC, rotation time 0.5 s, detector collimation 64 × 0.625 mm, slice thickness 3 mm, pitch 0.891 and iDose level 4 iterative reconstruction |
| 40–60 | Helical scan, 100 kVp, DoseRight AEC, rotation time 0.5 s, detector collimation 64 × 0.625 mm, slice thickness 3 mm, pitch 0.891 and iDose level 4 iterative reconstruction |
| >60 | Helical scan, 120 kVp, DoseRight AEC, rotation time 0.5 s, detector collimation 64 × 0.625 mm, slice thickness 3 mm, pitch 0.891 and iDose level 4 iterative reconstruction |
AEC, automatic exposure control.
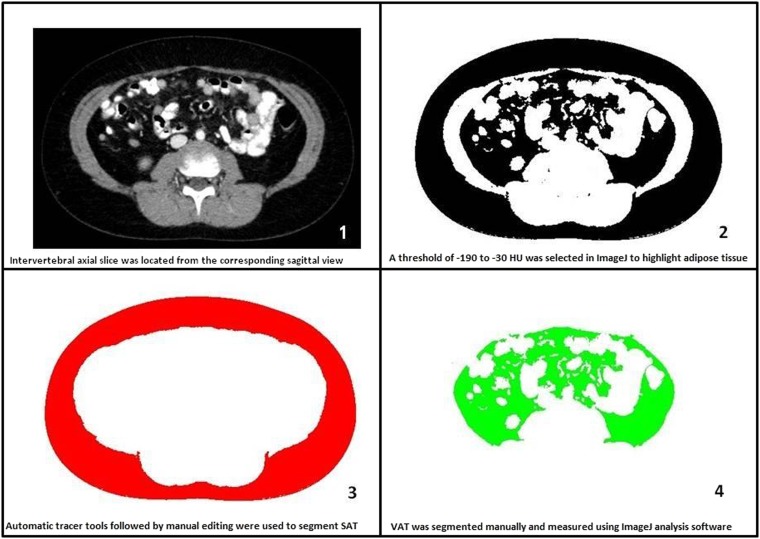
VAT area was measured at each intervertebral level between T12 and S1 (T12–L1, L1–L2, L2–L3, L3–L4, L4–L5 and L5–S1). All measurements were individually performed by three experienced blinded observers using ImageJ (National Institute of Health, Bethesda, MD) analysis software. Each observer performed measurements on the same monitor. Two readers were CT radiographers with between 5 and 10 years' experience. The third reader was the lead researcher. Duplicates of 10 CT scans were included to test intraobserver reliability. Adipose tissue was highlighted by setting threshold values of −190 to −30 HU, a threshold range used to identify VAT in many similar studies.20,25,26 VAT was then manually segmented from SAT by using the inner boundary of the abdominal muscle wall as the limit for VAT (Figure 1). This boundary did not include intermuscular and paravertebral adipose tissue in VAT calculation, as recommended.5
Figure 1.
Step-by-step visceral adipose tissue (VAT) segmentation. SAT, subcutaneous adipose tissue.
Abdominal VAT volume, between T12 and S1, was then derived from VAT area measurements taken at each slice using an established formula as seen below:27
where V is volume, Ai is each scan's cross-sectional area, h is the between-slice interval, t is the thickness of each slice (t = 3 mm) and N is the total number of slices (N = 6). h was different by patient but constant within each patient. Ai was formed from the mean from the three readers.
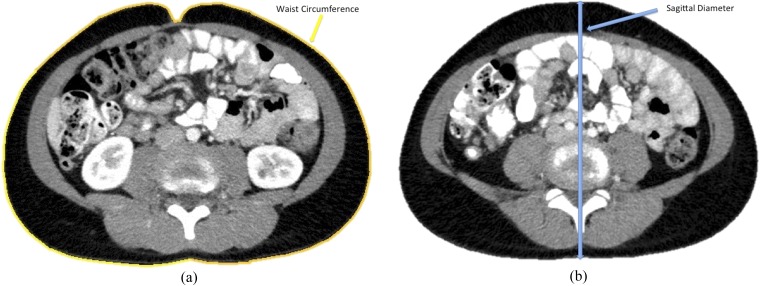
WC was measured on each CT scan at L3–L4 slice by using an automated border tracing measurement tool within ImageJ (National Institute of Health) (Figure 2a).28 SD was measured on each CT scan at the level of L4–L5 by measuring the vertical distance between the posterior and anterior skin surfaces (Figure 2b).
Figure 2.
(a) Waist circumference measurement. (b) Sagittal diameter measurement.
Statistical analysis
Descriptive statistics were used to describe the population sample. Interobserver and intraobserver reliability were assessed with use of intraclass correlation coefficients (ICCs), using two-way random models with measures of absolute agreement. Single-slice VAT measurements were correlated with total VAT volume for each slice using Pearson's correlation as data sets were normal in distribution. The slice with the highest correlation with the overall VAT volume was identified. Fisher Z transformation was used to test the statistical significance between the correlation coefficients of this slice and correlation coefficient of all of the other slices in each age group and gender. The single slice with the highest Pearson's r, along with slices that were not significantly different from this slice (p > 0.05), was deemed the most representative slices for VAT measurements in each subgroup. Confidence intervals were calculated for each correlation coefficient. Partial correlation coefficients were calculated between the highest correlated slice with VAT volume and each alternative slice to assess how much the remaining slices add. Linear regression analysis was used to evaluate WC, SD and gender as VAT volume predictors using the Wald test for each predictor. Statistical significance was indicated at a two-sided value of p < 0.05 for all statistical tests.
RESULTS
Equal numbers of males and females in each age group were randomly sampled; 0–3, 3–6, 6–9 years etc. The percentage of obese patients in each age group was as follows: 1.6% of 3–6 years, 4.5% of 6–9 years, 14.8% of 9–12 years and 24.2% of 12–16 years. Five subjects with WC greater than the field of view of the scanner were excluded from the study. One subject with an abnormal abdominal mass affecting WC was excluded. Table 2 shows the sample characteristics. The mean VAT measurements from the individual slices most representative of VAT volume in each age group and gender are presented in Table 3.
Table 2.
Mean abdominal visceral adipose tissue volumes and standard deviation for each age group and gender
| Age (years) | Female (n = 13) (cm3) | Male (n = 13) (cm3) | All (n = 26) (cm3) |
|---|---|---|---|
| 0–3 | 70.4 ± 22.7 | 114 ± 29.9 | 107.2 ± 27.7 |
| 3–6 | 160.2 ± 54.6 | 107 ± 32.9 | 134.5 ± 44.2 |
| 6–9 | 211.9 ± 84.8 | 172 ± 91 | 191.9 ± 88.53 |
| 9–12 | 177.3 ± 79.5 | 315.9 ± 122 | 246.6 ± 106 |
| 12–16 | 472.4 ± 159 | 394 ± 138.4 | 433.2 ± 152 |
Table 3.
Mean visceral adipose tissue (VAT) area for slices best correlated with VAT volume in each age group and gender
| Age (years) | Gender | Slice best correlated with VAT | Slice VAT area (cm2), mean ± SD |
|---|---|---|---|
| 0–3 | Male | L2–L3 | 10.36 ± 2.4 |
| Female | L2–L3 | 7.45 ± 1.9 | |
| 3–6 | Male | L2–L3 | 10.89 ± 2.1 |
| Female | L2–L3 | 11.6 ± 2.9 | |
| 6–9 | Male | L1–L2 | 13.86 ± 4.8 |
| Female | L4–L5 | 18.89 ± 3.9 | |
| 9–12 | Male | L1–L2 | 19.82 ± 5.1 |
| Female | L2–L3 | 13.99 ± 3.7 | |
| 12–16 | Male | L1–L2 | 21.99 ± 5.2 |
| Female | L1–L2 | 18.98 ± 6.8 |
SD, standard deviation.
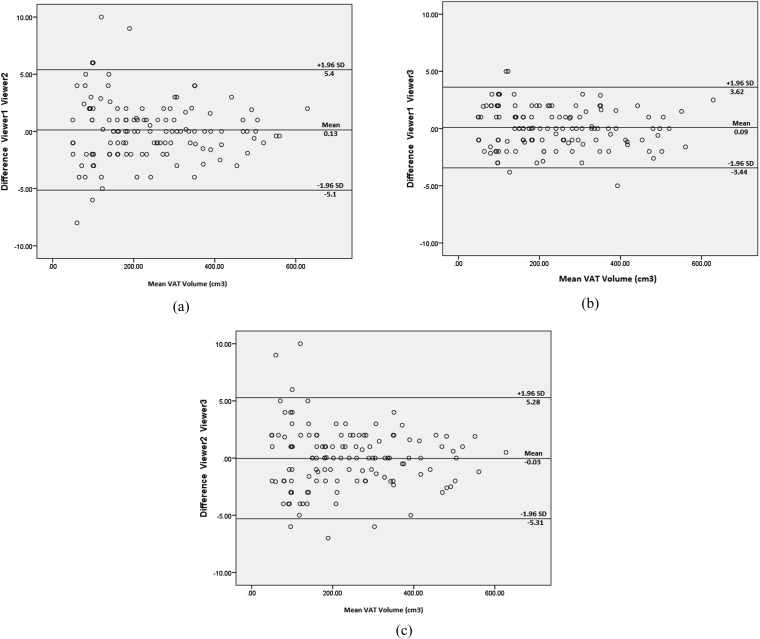
Intraviewer and interviewer reliability were excellent for all measurements performed with ICC ≥0.89 for VAT measurements, WC measurements and SD measurements (p < 0.001). Graphical representation of the interviewer VAT volume measurement reproducibility can be seen on Bland–Altman plots (Figures 3a–c).
Figure 3.
Bland–Altman plot: difference in Viewer 1 and Viewer 2 visceral adipose tissue (VAT) measurements (a); difference in Viewer 1 and Viewer 3 VAT measurements (b); difference in Viewer 2 and Viewer 3 VAT measurements (c). The outer lines delineate the limits of agreement between the two viewers, respectively. SD, standard deviation.
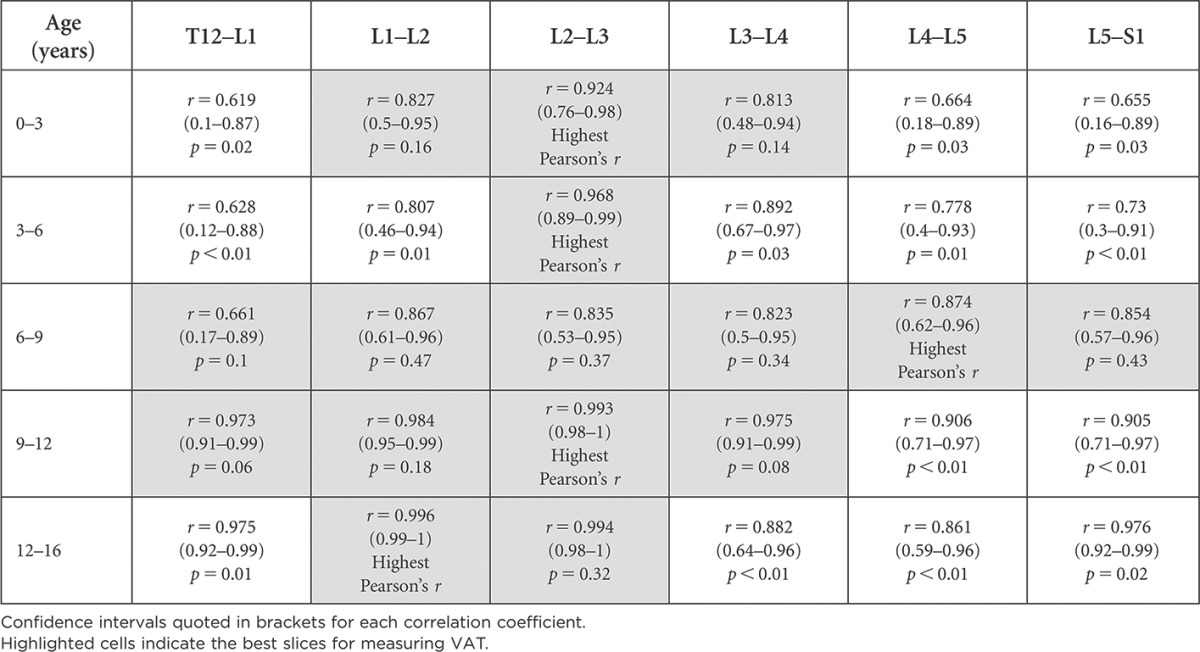
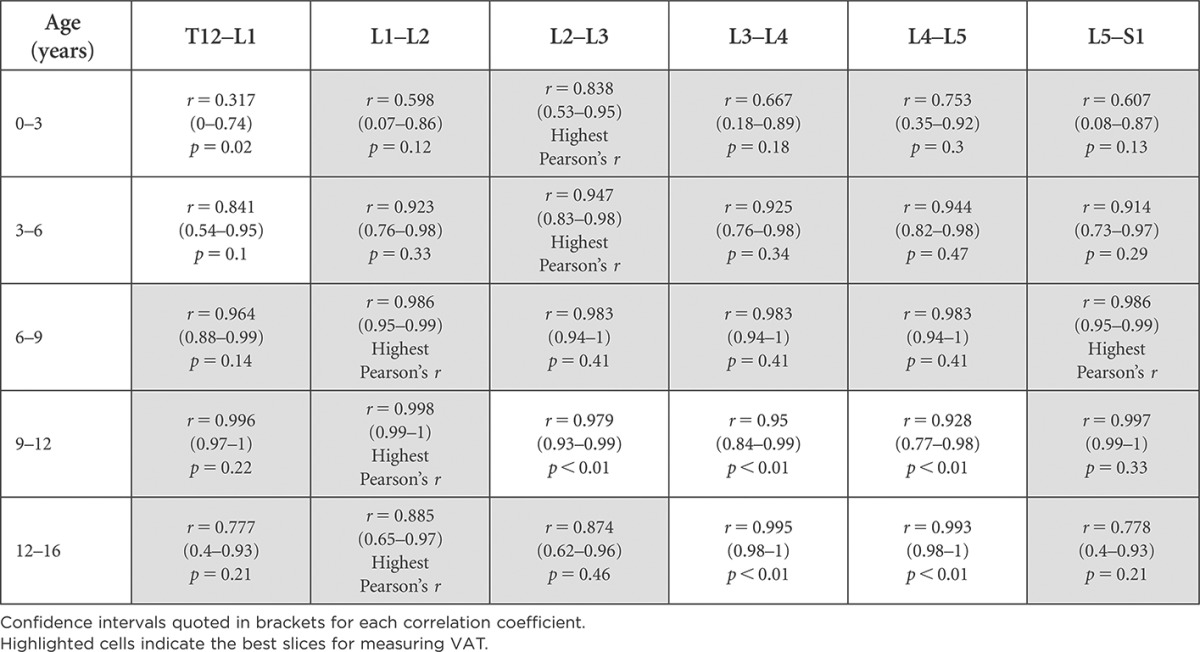
Tables 4 and 5 highlight the vertebral levels at which VAT area measurements were best correlated with abdominal VAT volume in females and males. Slices with the highest correlation with abdominal VAT volume were labelled “Highest Pearson's r”. Slices with statistically significantly lower correlation coefficients (p < 0.05) have not been highlighted. The highlighted slices indicate the best single slices for measuring VAT, as these are most representative of the entire abdominal VAT volume.
Table 4.
Vertebral levels appropriate for visceral adipose tissue (VAT) measurement based on Pearson's correlation (r) with total VAT volume for females and statistical significance between correlation coefficients (p-value)
Confidence intervals quoted in brackets for each correlation coefficient.
Highlighted cells indicate the best slices for measuring VAT.
Table 5.
Vertebral levels appropriate for visceral adipose tissue (VAT) measurement based on Pearson's correlation (r) with total VAT volume for males and statistical significance between correlation coefficients (p-value)
Confidence intervals quoted in brackets for each correlation coefficient.
Highlighted cells indicate the best slices for measuring VAT.
As seen in Tables 4 and 5, there are multiple slices appropriate for VAT measurements in each age category; however, only one slice location is recommended for use across all age groups in females; the axial slice located at L2–L3. In males, axial slices at two locations, L1–L2 and L5–S1, are deemed best for acquiring single-slice VAT measurements across all age groups, having the highest correlation.
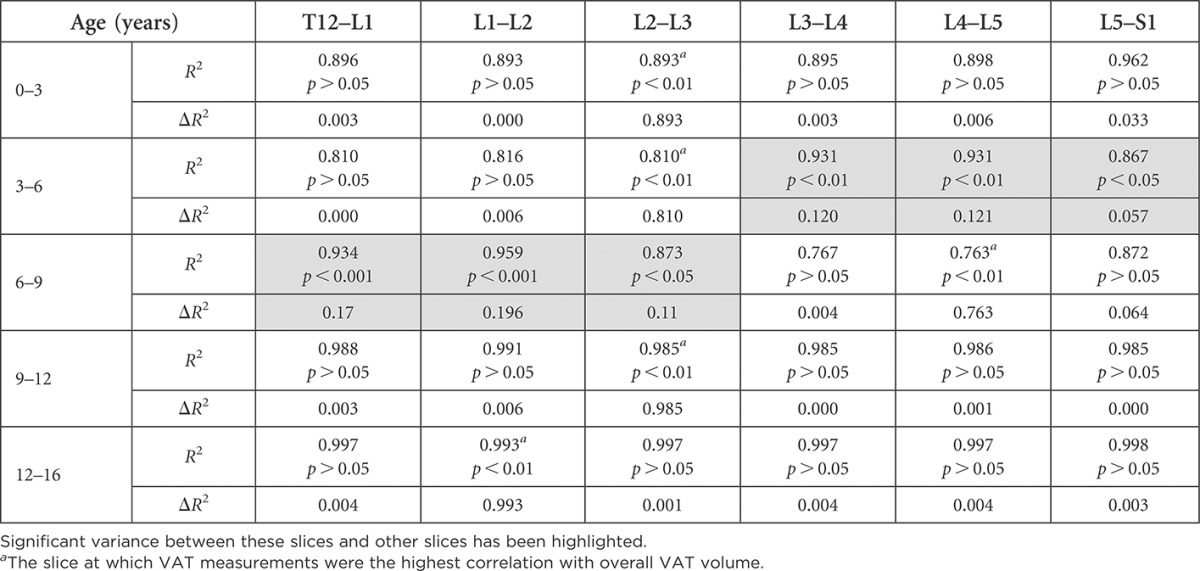
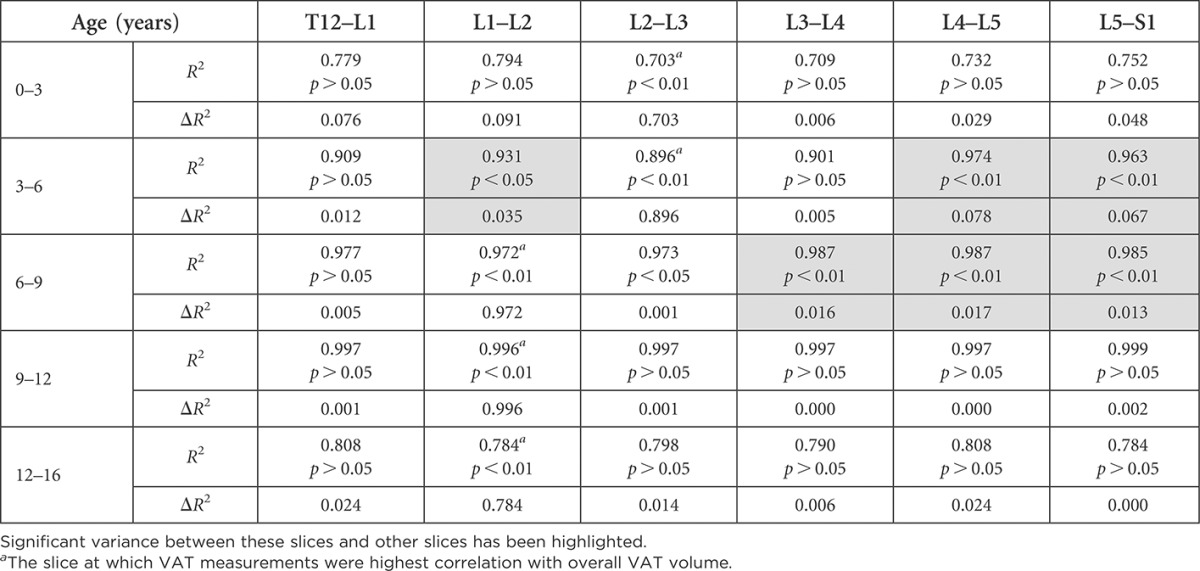
An assessment of how much remaining slices contribute to VAT information can be seen in Tables 6 and 7, where those that add significant information additional to the slice highly correlated with VAT have been highlighted. “The correlation matrix displays the high correlation found between VAT measurements at individual slices and all other slices within the abdomen” (Table 8).
Table 6.
Comparison of the variance in visceral adipose tissue (VAT) explained by each slice in females by age group
Significant variance between these slices and other slices has been highlighted.
The slice at which VAT measurements were the highest correlation with overall VAT volume.
Table 7.
Comparison of the variance in visceral adipose tissue (VAT) explained by each slice in males by age group
Significant variance between these slices and other slices has been highlighted.
The slice at which VAT measurements were highest correlation with overall VAT volume.
Table 8.
Correlation between individual slices for entire paediatric population
| Slice | T12–L1 | L1–L2 | L2–L3 | L3–L4 | L4–L5 |
|---|---|---|---|---|---|
| L1–L2 |
r = 0.997 p < 0.001 |
||||
| L2–L3 |
r = 0.941 p < 0.001 |
r = 0.961 p < 0.001 |
|||
| L3–L4 |
r = 0.888 p < 0.001 |
r = 0.923 p < 0.001 |
r = 0.974 p < 0.001 |
||
| L4–L5 |
r = 0.839 p < 0.001 |
r = 0.873 p < 0.001 |
r = 0.94 p < 0.001 |
r = 0.966 p < 0.001 |
|
| L5–S1 |
r = 0.892 p < 0.001 |
r = 0.908 p < 0.001 |
r = 0.948 p < 0.001 |
r = 0.96 p < 0.001 |
r = 0.938 p < 0.001 |
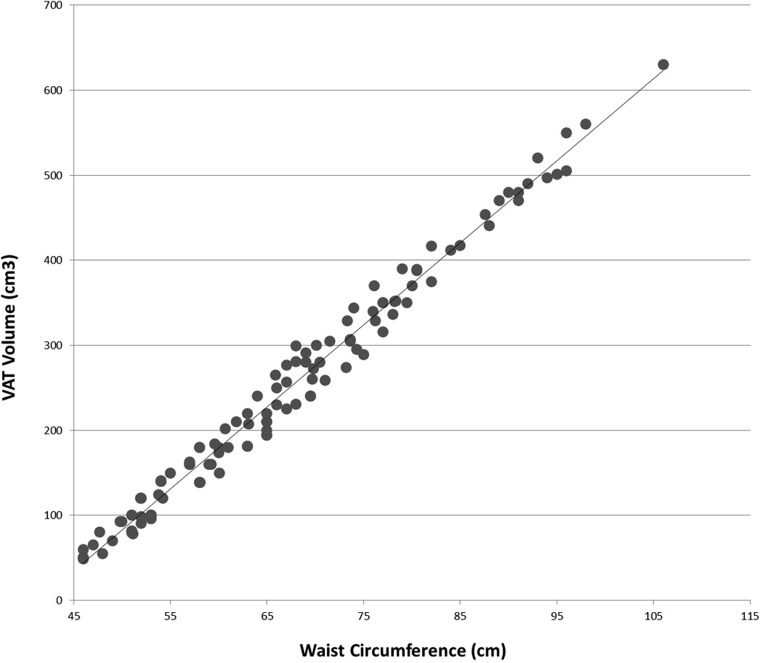
Regression between WC, SD, gender and VAT volume showed that WC was most predictive of VAT volume (beta = 0.970, p < 0.001). With an adjusted R2 value of 0.546, our regression model for the combination of WC, SD and gender accounted for 55% of the variance in the criterion; p < 0.001, i.e. our model is statistically significant. Figure 4 illustrates the relationship between WC and VAT volume.
Figure 4.
Plot of waist circumference vs visceral adipose tissue (VAT) volume.
DISCUSSION
To date, our study is the first to investigate the relationship between WC, SD, gender and VAT volume in paediatrics. Of these, we found that WC was the only significant indicator of VAT volume in children (beta = 0.970, p < 0.001). Previous studies15,29 carried out on adult populations also report that WC is strongly correlated with VAT volume. WC is an easy measurement to perform and can be performed with simple measuring tape or via cross-sectional imaging. Our findings, that WC was a significant indicator of VAT, along with a growing body of evidence suggesting that VAT is an independent correlate of obesity-related medical conditions such as cardiovascular disease, metabolic syndrome, insulin resistance, diabetes and even some forms of cancer, demonstrate the important role WC measurements have in predicting health risks.1,4,6–12
Another aim of this study was to establish the best single CT slice for predicting total abdominal VAT volume in paediatrics. Prior to doing so, we needed to ascertain whether VAT quantification performed on paediatric CT scans was feasible. As paediatric patients are much smaller than adults, we had concerns that manual segmentation of VAT may be more difficult to perform on paediatric images than on adults. However, our study demonstrated excellent intraviewer and interviewer reproducibility, suggesting that VAT quantification is easy to perform on paediatric CT scans and highly reproducible. CT generates relatively consistent tissue attenuation values which makes adipose tissue (−190 to −30 HU) easy to identify.25,26 CT is also relatively cheap, widely accessible and fast. The accuracy and reproducibility of measurements in this study further validates the use of CT for VAT quantification in paediatrics.
Interestingly, we found multiple optimal slice locations for VAT quantification across each age group and gender, except in 3- to 6-year-old females, in which L2–L3 alone was the best (see highlighted slices in Tables 4 and 5). The difference between the slice with the highest correlation with VAT volume and some other slices with high correlation values was not statistically significant, indicating that these slices could also be used for VAT measurement. We then assessed the amount of additional information that could be gained by measuring VAT on a second slice, in addition to measuring VAT on the single slice highly correlated with VAT volume (Tables 6 and 7). In most age groups and genders, no significant additional information would be gained by measuring a second slice. Exceptions were found in the 3- to 6-year-old females, where there was a 12.1% change by adding measurements at slice L4–L5, and in 6- to 9-year-old females, where there was a 19.6% change by adding slice L1–L2 measurements. Small changes (1.7–7.8%) were found by adding a second slice in males aged 3–9 years.
To our knowledge, only two other studies19,20 have researched the best single-slice location in children. Lee et al19 found that VAT measurements 5 cm (R2 = 0.93) and 10 cm (R2 = 0.93) above L4–L5 best correlated with overall abdominal VAT mass (p < 0.05) in white-American children aged 8–18 years (N = 54). Our findings were similar in a comparable age group (9–16 years) but more specific in location as we assessed more slices at each intervertebral level from T12 to S1. We too found slices located in the upper abdomen (L1–L2 and L2–L3 in females) (T12–L1 and L1–L2 in males) were the best for VAT measurement (Tables 5 and 6). Contrary to Lee et al, we found L5–S1 was also highly correlated with VAT volume in males.
We found that just one slice, located at L2–L3, was the best for VAT quantification across all age groups in females. In males, slices at both L1–L2 and L5–S1 were appropriate for VAT measurements across all age groups. We are unsure as to why this difference exists. Differences in VAT distribution between males and females may be influenced by hormonal secretion, sexual maturation, skeletal growth, diet or physical activity level. Both our study and the study carried out by Lee et al indicate that the anatomical locations most often sampled in most previous studies14–16 on adult populations (L4–L5 or the level of the umbilicus) are not suitable locations for VAT measurements in children. According to our results, using L4–L5 for VAT quantification in male children above 9 years of age and in females under 6 and above 9 years of age is not the best practice.
Contrary to our findings, Blitman et al20 found that VAT measurements obtained at the level of the umbilicus were best correlated with overall VAT volume on a sample of children aged 8–14 years (r = 0.96, p < 0.001), which would imply that best measurement site in children was similar to that in adults. However, these results were based on a much smaller sample of 21 patients (9 males and 12 females) of different race and age (8–14 years). Umbilical VAT measurements vary widely between races, e.g. VAT measurements at the level of the umbilicus are significantly lower in African American children than in white American children.30,31 The difference between sample size and population may have influenced differences in our findings and those of Blitman et al.20 Each study categorized children by race to investigate differences in fat distribution. However, their samples were not stratified according to age or gender, both of which also affect fat distribution.
Limitations of this study include a relatively small sample size upon stratification. The children in this study population were Caucasians; therefore, it may not be possible to generalize findings to the wider paediatric population. Also, there were a varying number of obese children in each age category, which may have influenced the findings; however, the use of randomized sample should have limited this. The retrospective nature of this study did not allow for clear identification of clinical diagnosis. Thus, we are unable to comment on whether any of these children had abdominal pathology or received any medical treatments that may have influenced fat deposition. However, radiologist reports accompanying each scan were reviewed to exclude those with intra-abdominal abnormalities affecting fat distribution, WC and SD measurements.
CONCLUSION
While multiple slices were found to be strongly correlated for VAT volume in each subgroup, only one slice, L2–L3, was the best for VAT quantification across female children of all ages (0–16 years). In males, VAT measurements at two slice locations, L1–L2 and L5–S1, were the most representative of VAT volume across all age groups. WC is an excellent indicator of abdominal VAT volume in children.
Contributor Information
Michelle O'Connor, Email: michelle.oconnor@ucd.ie.
John Ryan, Email: john.ryan@ucd.ie.
Shane Foley, Email: shane.foley@ucd.ie.
REFERENCES
- 1.World Health Organization. Obesity and overweight fact sheet N°311. 2014. pp. 1–5. http://www.who.int/mediacentre/factsheets/fs311/en/ [Google Scholar]
- 2.Hyattsville M. National Center for Health Statistics. Health, United States, 2011: with special features on socioeconomic status and health. Washington, DC: US Government Printing Office; 2011. [PubMed] [Google Scholar]
- 3.Ogden CL, Carroll MD, Kit BK, Flegal KM. Prevalence of childhood and adult obesity in the United States, 2011–2012. JAMA 2014; 311: 806–14. doi: 10.1001/jama.2014.732 [DOI] [PMC free article] [PubMed] [Google Scholar]
- 4.Queen Samour P, King Helm K. Handbook of pediatric nutrition. Burlington, MA: Jones and Bartlett Publishers; 2005. [Google Scholar]
- 5.Shen W, Wang Z, Punyanita M, Lei J, Sinav A, Kral JG, et al. Adipose tissue quantification by imaging methods: a proposed classification. Obes Res 2003; 11: 5–16. doi: 10.1038/oby.2003.3 [DOI] [PMC free article] [PubMed] [Google Scholar]
- 6.Brochu M, Starling RD, Tchernof A, Matthews DE, Garcia-rubi E, Poehlman ET. Visceral adipose tissue is an independent correlate of glucose disposal in older obese postmenopausal women. J Clin Endocrinol Metab 2000; 85: 2378–84. doi: 10.1210/jcem.85.7.6685 [DOI] [PubMed] [Google Scholar]
- 7.Cruz ML, Bergman RN, Goran MI. Unique effect of visceral fat on insulin sensitivity in obese Hispanic children with a family history of type 2 diabetes. Diabetes Care 2002; 25: 1631–7. doi: 10.2337/diacare.25.9.1631 [DOI] [PubMed] [Google Scholar]
- 8.Brambilla P, Manzoni P, Agostini G, Beccaria L, Ruotolo G, Sironi S, et al. Persisting obesity starting before puberty is associated with stable intraabdominal fat during adolescence. Int J Obes Relat Metab Disord 1999; 23: 299–303. doi: 10.1038/sj.ijo.0800815 [DOI] [PubMed] [Google Scholar]
- 9.He Q, Horlick M, Fedun B, Wang J, Pierson RN, Jr, Heshka S, et al. Trunk fat and blood pressure in children through puberty. Circulation 2002; 105: 1093–8. [DOI] [PubMed] [Google Scholar]
- 10.Polat B, Urganci N, Calıskan K, Akyıldız B. Correlation of abdominal fat accumulation and stiffness of the abdominal aorta in obese children. J Pediatr Endocrinol Metab 2008; 21: 1031–40. doi: 10.1515/JPEM.2008.21.11.1031 [DOI] [PubMed] [Google Scholar]
- 11.Gantz M, Chen J, Heymsfield SB, Shen W. Intraperitoneal adipose tissue: associated health risks, quantification by advanced imaging methods and future directions in children. Open Obes J 2011; 3: 34–41. doi: 10.2174/1876823701103010034 [DOI] [Google Scholar]
- 12.Goran MI, Gower BA. Relation between visceral fat and disease risk in children and adolesents. Am J Clin Nutr 1999; 70: 149S–56S. [DOI] [PubMed] [Google Scholar]
- 13.Abate N, Burns D, Peshock RM. Estimation of adipose tissue mass by magnetic resonance imaging: validation against dissection in human cadavers. J Lipid Res 1994; 35: 1490–6. [PubMed] [Google Scholar]
- 14.Kopelman P, Caterson I, Dietz W. Clinical obesity in adults and children. Oxford, UK: Wiley-Blackwell; 2009. [Google Scholar]
- 15.Furukawa K, Katabami T, Nakajima Y, Sato T, Kato H, Koganei R, et al. Evaluation of whole-abdominal fat volume by 700-slice CT scanning and comparison with the umbilical fat area anthropometric indices. Obes Res Clin Pract 2010; 4: e83–162. doi: 10.1016/j.orcp.2009.10.001 [DOI] [PubMed] [Google Scholar]
- 16.Shen W, Punyanitya M, Wang Z, Gallagher D, Heymsfield SB, Heshka S. Visceral adipose tissue: relations between single-slice areas and total volume. Am J Clin Nutr 2004; 80: 271–8. [DOI] [PMC free article] [PubMed] [Google Scholar]
- 17.Shen W, Punyanitya M, Chen J, Gallagher D, Albu J, Pi-Sunyer X, et al. Visceral adipose tissue: relationships between single slice areas at different locations and obesity-related health risks. Int J Obes (Lond) 2007; 31: 763–9. [DOI] [PMC free article] [PubMed] [Google Scholar]
- 18.So R, Sasai H, Matsuo T, Tsujimoto T, Eto M, Saotome K, et al. Visceral adipose tissue volume estimated at imaging sites 5-6 cm above L4-L5 is optimal for predicting cardiovascular risk factors in obese Japanese men. Tohoku J Exp Med 2012; 227: 297–305. doi: 10.1620/tjem.227.297 [DOI] [PubMed] [Google Scholar]
- 19.Lee S, Kuk JL, Kim Y, Arslanian SA. Measurement site of visceral adipose tissue and prediction of metabolic syndrome in youth. Pediatr Diabetes 2011; 12: 250–7. doi: 10.1111/j.1399-5448.2010.00705.x [DOI] [PMC free article] [PubMed] [Google Scholar]
- 20.Blitman NM, Baron LS, Berkenblit RG, Schoenfeld AH, Markowitz M, Freeman K. Feasibility of using single-slice MDCT to evaluate visceral abdominal fat in an urban pediatric population. AJR Am J Roentgenol 2011; 197: 482–7. doi: 10.2214/AJR.10.5514 [DOI] [PubMed] [Google Scholar]
- 21.Allen L, Prentice A. Encyclopedia of human nutrition, four-volume set. Oxford, UK: Elsevier Academic Press; 2005. [Google Scholar]
- 22.Hirooka MH, Kumagi TK, Kurose KK, Nakanishi SN. A technique for the measurement of visceral fat by ultrasonography: comparison of measurements by ultrasonography and computed tomography. Intern Med 2005; 44: 794–9. [DOI] [PubMed] [Google Scholar]
- 23.Irish Universities Nutrition Alliance. National Teens' Food Survey. 2007 pp. 1–19. Available from: www.iuna.net
- 24.Irish Universities Nutrition Alliance. National Children's Food Survey. 2009 pp. 1–19. Available from: www.iuna.net
- 25.Klopfenstein BJ, Kim MS, Krisky CM, Szumowski J, Rooney WD, Purnell JQ. Comparison of 3 T MRI and CT for the measurement of visceral and subcutaneous adipose tissue in humans. Br J Radiol 2012; 85: e826–30. doi: 10.1259/bjr/57987644 [DOI] [PMC free article] [PubMed] [Google Scholar]
- 26.Sottier D, Petit J, Guiu S, Hamza S, Benhamiche H, Hillon P, et al. Quantification of the visceral and subcutaneous fat by computed tomography: interobserver correlation of a single slice technique. Diagn Interv Imaging 2013; 94: 879–84. doi: 10.1016/j.diii.2013.04.006 [DOI] [PubMed] [Google Scholar]
- 27.Shen W, Wang Z, Tang H, Heshka S, Punyanitya N, Zhu S, et al. Volume estimates by imaging methods: model comparisons with visible woman as the reference. Obes Res 2003; 11: 217–25. doi: 10.1038/oby.2003.34 [DOI] [PMC free article] [PubMed] [Google Scholar]
- 28.Wajchenberg B. Subcutaneous and visceral adipose tissue: their relation to the metabolic syndrome. Endocr Rev 2000; 21: 697–738. doi: 10.1210/edrv.21.6.0415 [DOI] [PubMed] [Google Scholar]
- 29.Janssen I, Heymsfield SB, Allison DB, Kotler DP, Ross R. Body mass index and waist circumference independently contribute to the prediction of nonabdominal, abdominal subcutaneous, and visceral fat 1–3. Am J Clin Nutr 2002; 75: 683–8. [DOI] [PubMed] [Google Scholar]
- 30.Goran M, Nagy T, Treuth M, Trowbridge C, Dezenburg C, McGloin A, et al. Visceral fat in white and African American prepubertal children. Am J Clin Nutr 1997; 65: 1703–8. [DOI] [PubMed] [Google Scholar]
- 31.Huang T, Johnson M, Figueroa-Colon R, Dwyer J, Goran M. Growth of visceral fat, subcutaneous abdominal fat, and total body fat in children. Obes Res 2001; 9: 283–9. doi: 10.1038/oby.2001.35 [DOI] [PubMed] [Google Scholar]


