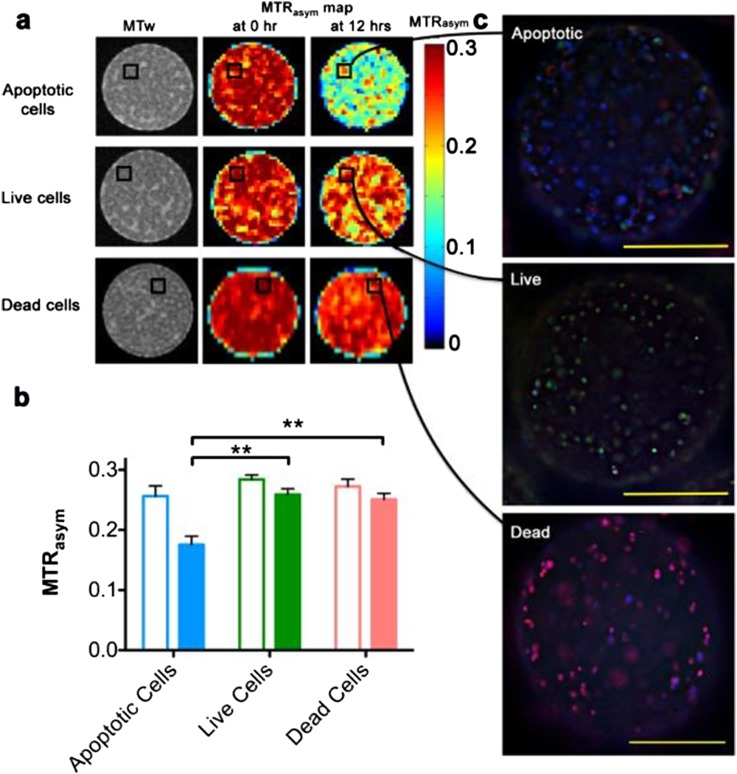
Figure 4.
Imaging the functional status of cells by lipoCEST nanosensors. (a) MR images of LipoCEST capsules containing hepatocytes. Shown are magnetization transfer-weighted (MTw) images and magnetization transfer ratio (MTR) asymmetry (MTRasym) maps at 2 ppm of various cell samples. “Apoptotic cells”: LipoCEST capsules containing hepatocytes before (0 h) and after (12 hrs) addition of 50 μM staurosporine. “Live cells”: LipoCEST capsules containing hepatocytes without the addition of staurosporine imaged at time points 0 and 12 h. “Dead cells”: LipoCEST capsules containing hepatocytes treated with STS before encapsulation imaged at time points 0 and 12 h. (b) MTRasym for the three groups at 0 h (open bars) and 12 h (solid bars). (c) Fluorescence overlay images of capsules from the STS and control phantoms shown in (a). Samples are stained for live cells (fluorescein diacetate, green), dead cells (propridium iodide, red) and apoptotic cells (Annexin V, blue). Scale bar = 200 μm. ** indicates statistical significance for the difference in measured values. Reprinted from Chan et al85 with permission from Nature Publishing Group.

