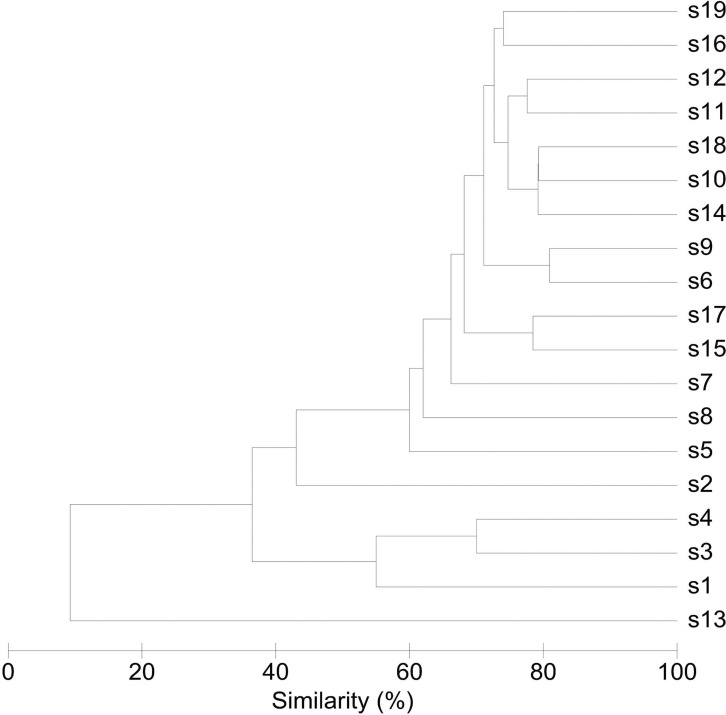
Figure 2. Similarity between bacterial communities in endometrial samples (n = 19).
The dendrogram was constructed by agglomerative hierarchical clustering (group-average) based on a relative abundance matrix of phylotypes. The percentage of similarity between the communities was calculated using the Bray-Curtis similarity algorithm.

