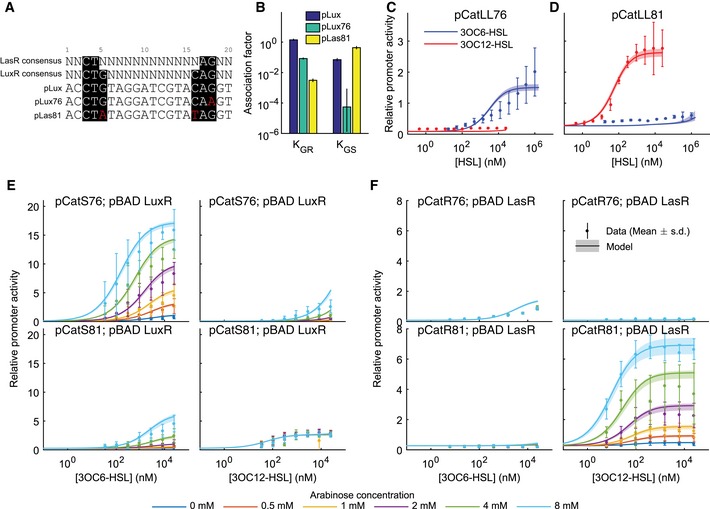
Figure 2. Base pair changes in the Lux promoter can produce 3OC6HSL‐ or 3OC12HSL‐specific responses.

- A sequence comparison between the Lux box and a consensus LasR recognition sequence suggests targets for base pair changes to generate specificity. Consensus‐binding sequences are highlighted in black while specific mutations are in red. pLux76 and pLas81 were chosen for greatest minimization of crosstalk from a group of potential specific promoters.
- Inferred association constants of LuxR (K GR) or LasR (K GS) with pLux, pLux76, or pLas81.
- The relative activity of pLux76 in the presence of weak expression of both receiver proteins (plasmid pCatLL76) as a function of 3OC6HSL (blue points) or 3OC12HSL (red points).
- The relative activity of pLas81 in the presence of weak expression of both receiver proteins (plasmid pCatLL81) as a function of 3OC6HSL (blue points) or 3OC12HSL (red points).
- The relative activity of pLux76 (top) or pLas81 (bottom) in the presence of weak expression of LasR and inducible expression of LuxR (plasmids pCatS76 and pBADLuxR or plasmids pCatS81 and pBADLuxR) as a function of 3OC6HSL concentration (left) or 3OC12HSL concentration (right). Inducible expression was varied via arabinose concentration as indicated by the color code.
- The relative activity of pLux76 (top) or pLas81 (bottom) in the presence of weak expression of LuxR and inducible expression of LasR (plasmids pCatR76 and pBADLasR or plasmids pCatR81 and pBADLasR) as a function of 3OC6HSL concentration (left) or 3OC12HSL concentration (right). Inducible expression was varied via arabinose concentration as indicated by the color code.
