
Figure 1. Cells undergo a complex response to DTT treatment.
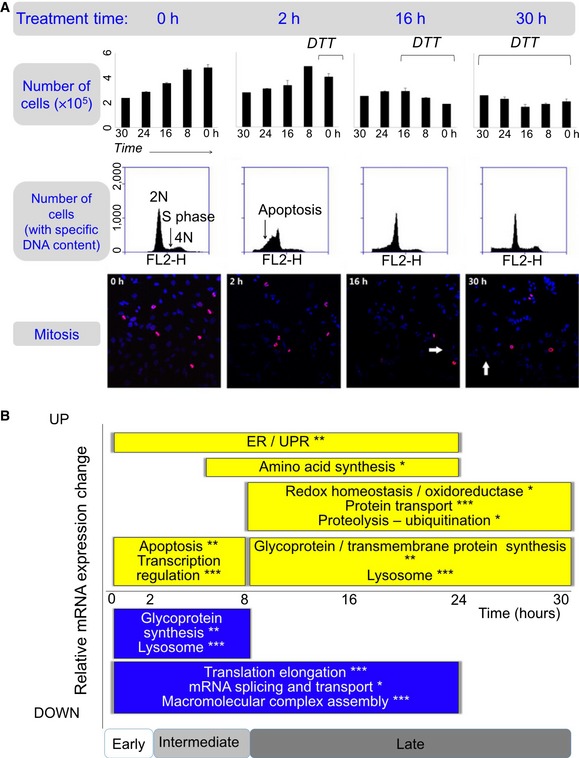
While a proportion of cells were apoptotic during the first 2 h of the experiment, the majority of the cells continued cell division and displayed an extensive ER stress response.
- We estimated the degree of active cell division based on the cell density changes, the distribution of the DNA content, and the degree of active mitosis. Top panel: Bar graphs show numbers of live cells, with mean and standard deviations. Black lines, DTT treatment time. Middle panel: Quantitative analysis of cell cycle phases by flow cytometry using propidium iodide staining of DNA for cells treated with DTT for different periods of time. The 2N, 4N peaks and S‐phase plateau were observed in all time points, suggesting active cell division. Bottom panel: Immunofluorescence experiments show mitotic nuclei in red (anti‐phospho‐histone H3 (Ser10) antibody) and other nuclei in blue (DAPI). Mitotic nuclei were observed throughout the entire experiment. The ratio between the number of mitotic and all nuclei was similar among all the stress phases (not shown). White arrows, apoptotic nuclei. All experiments were performed in triplicate. The complete data are in Appendix Fig S3.
- Summary of function enrichment of mRNA expression changes (FDR < 0.05, *P < 0.001, **P < 0.0001, and ***P < 0.00001). The corresponding expression data are shown in Appendix Fig S5. While some apoptosis occurred, remaining cells underwent intense unfolded protein and ER stress response.