
Figure 2. RNA and protein expression changes are highly dynamic.
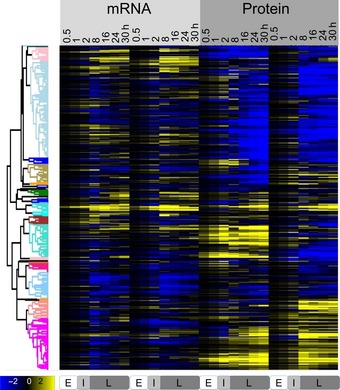
The heatmap shows the normalized, relative expression values for both mRNA and protein measured across two replicates (N = 1,237), log‐transformed (base 10). Profiles were clustered as described in Materials and Methods; the cluster definitions are provided in Dataset EV1. Bottom labels E, I, L mark the early, intermediate, and late phase, respectively.