
Figure 6. PECA identifies groups of similarly regulated genes.
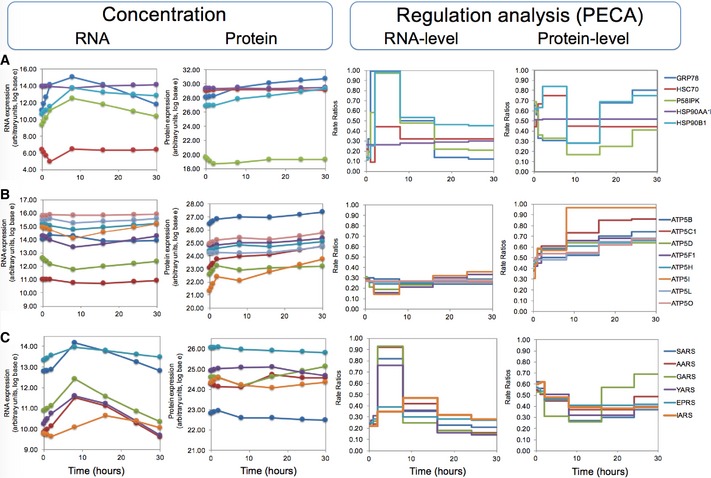
mRNA and protein concentrations are shown on the left; PECA results are shown on the right for RNA and protein level, respectively.
- Five chaperones, including GRP78, with mixed expression patterns.
- Eight subunits of ATP synthases observed in the experiment with mostly invariable RNA concentrations and increasing protein concentrations. PECA amplifies the hidden signal and identifies a significant protein‐level regulation.
- Six aminoacyl‐tRNA synthetases whose mRNA concentration increases temporarily, but the protein concentrations remain largely constant. PECA deconvolutes the two opposing regulatory effects that act at the RNA and protein levels.