Figure 4.
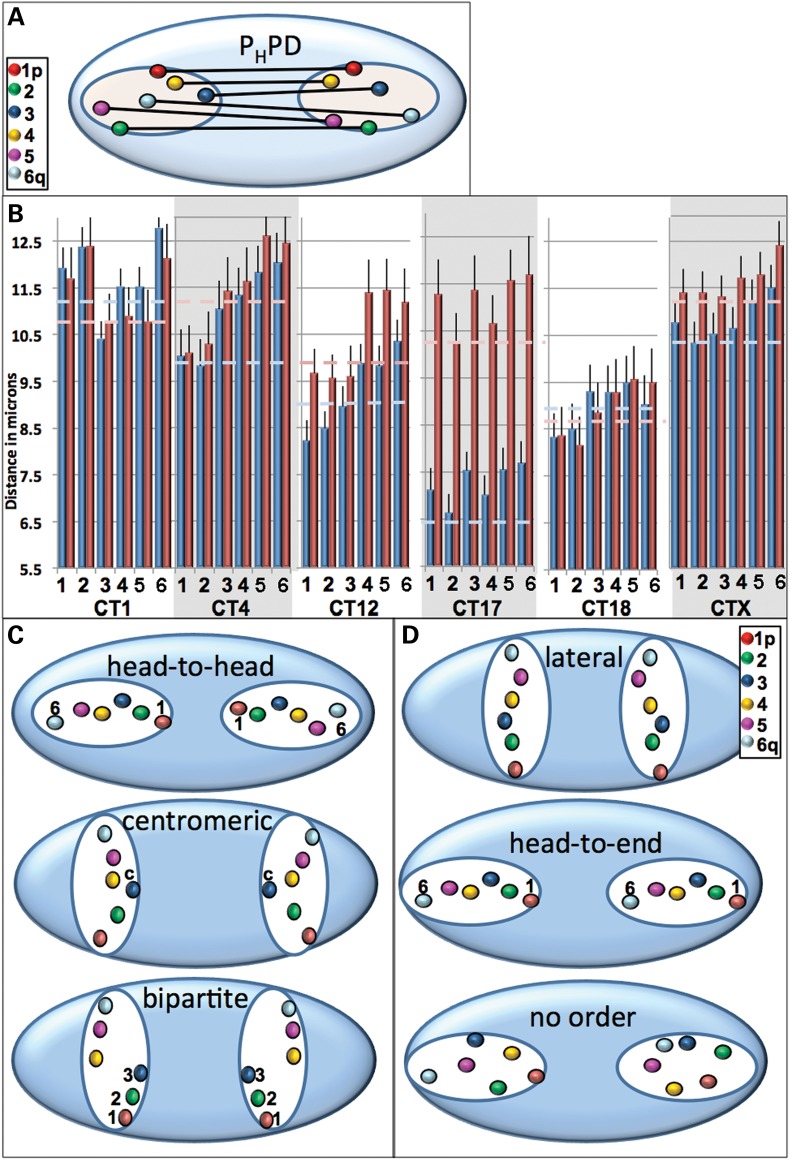
Internal orientation of homologous CT pairs. The 3D distances between the six labeled regions for each homologous CT pair were measured. A schematic diagram demonstrating these measurements is shown in (A) and experimental values in microns are presented in (B). Based on the pairwise distances between homologous probes, preferred patterns of spatial arrangement could be head-to-head (where the p arm telomeres were nearest and the distance between consecutive regions increased such that the q arm telomeres were the furthest), bipartite (distances between the entire region 1–3 are closer than the distances in the entire region 4–6) or centromeric (the centromeres are closest, C). If all homologous probes are equidistant, the CT would be oriented laterally, head-to-end or not ordered (D). Dashed lines in (B) represent the CT center to center distance for the entire CT in G1 (light blue) and S (pink) phase. Error bars denote SEM. Statistically significant differences in the 3D distances (P < 0.05) were found for the centromeric probe 3 in the G1 phase of CT1 compared with the other probes; between probes 1 or 2 and 5,6 in both G1 and S phase for CT4; between probes 1 and 4,5 6; 2 and 4,5,6 and 3 and 6 in G1 phase for CT12; between 1 and 4,5; 2 and 4,5,6; 3 and 4,5 in the S-phase of CT12 and between all the probes in G1 versus S for CT17.

