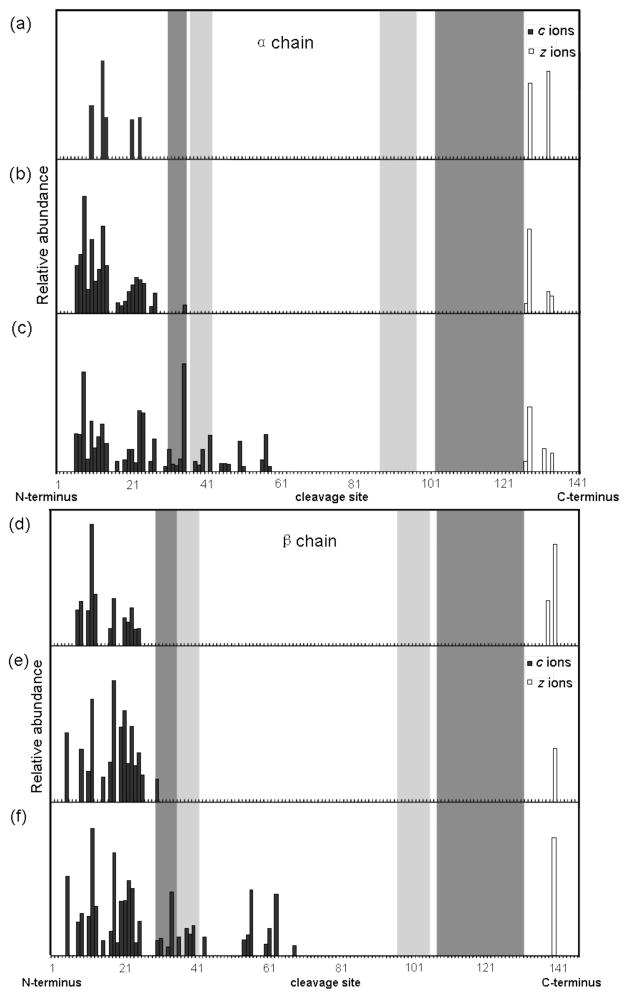
Figure 2.
Top-down ECD analysis of human Hb complex tetramers. Sequence cleavage map of the α chain: (a) funnel skimmer (FS) potential 30 V; (b) 60 V; (c) 80 V. Sequence cleavage map of the β chain: (d) FS 30 V; (b) 60 V; (c) 80 V. Source temperature was set at 200 °C, ESI capillary voltage 1000–1300 V. Dark shaded bars denote the backbone sequences involved in the dimer interface interactions; light shade bars denote sequences involved in the tetramer interface interactions.

