Figure 1.
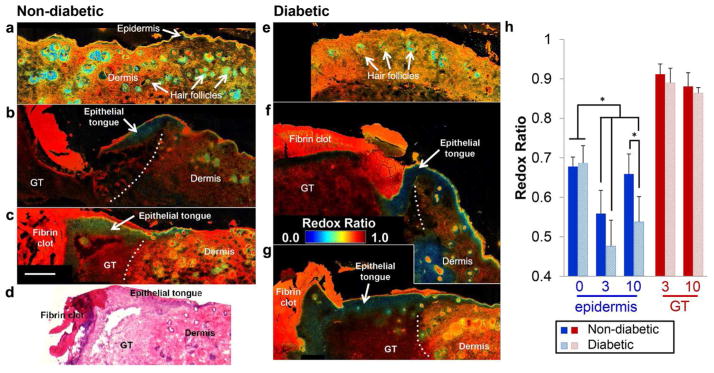
An optical redox ratio reveals spatial and temporal variability in cell metabolism at the wound edge of non-diabetic (a-c) and diabetic (e-g) mice on Day 0 (a, e), Day 3 (b, f), and Day 10 (c, g) post-wounding. Spatial variability in the redox ratio enables discrimination of wound regions similar to H&E staining (d). Average redox ratios at different time points from the epidermis and granulation tissue (GT) demonstrate significant changes in epithelial metabolism (h). A low redox ratio at Day 3 and thickening of the epithelial tongue by Day 10 is apparent for both groups (b-c, f-g). Dotted lines demarcate the wound edge. The epidermal redox ratio of diabetic wounds remains lower than controls at Day 10 (p=0.0303), indicating a delay in the re-epithelialization process. Error bars defined as mean ± SD, and * p < 0.05. Scale bar (= 250μm) in (c) applies to all micrographs.

