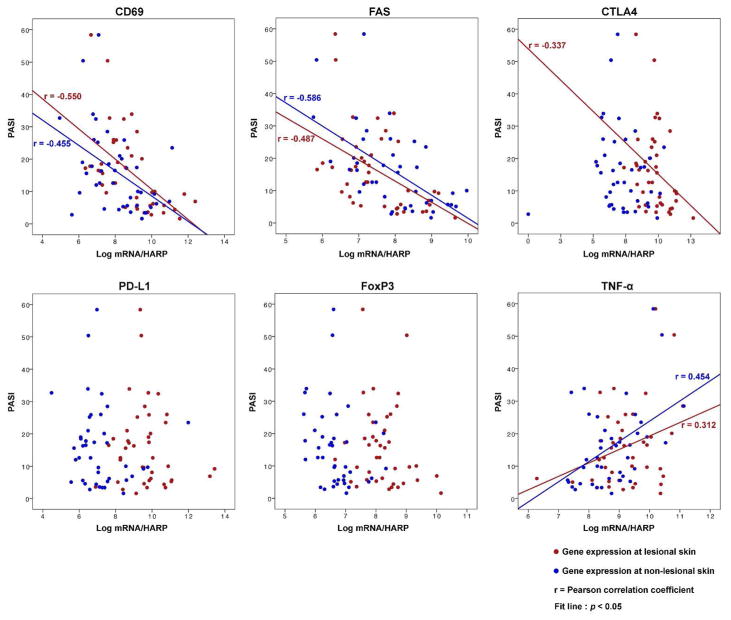
Figure 5. Correlation between PASI and expression levels of negative regulators in lesional and non-lesional skin.
Overlay scatter plot to display the correlation between PASI and expression levels of negative regulators (CD69, FAS, CTLA4, PD-L1, and FoxP3) in lesional (red) and non-lesional (blue) skin. The expression of TNF-α in lesional and non-lesional skin is presented as a control (Gene expression: Log2 conversion of mRNA expression normalized to human acidic ribosomal protein (HARP), PASI: Psoriasis Area and Severity Index).

