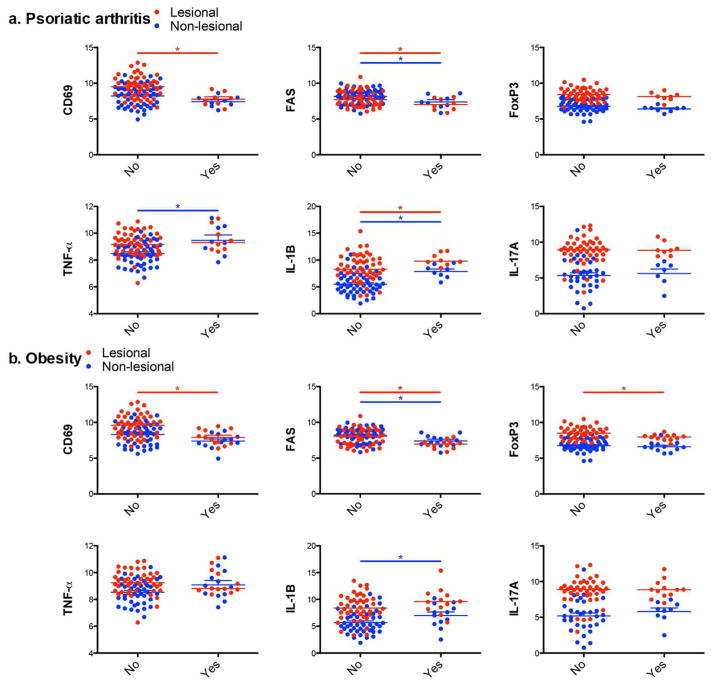
Figure 6. Downregulation of negative regulators and upregulation of driver cytokines in the skin of psoriasis patients with psoriatic arthritis/obesity.
Overlay scatter plot to display different expression levels of negative regulators (CD69, FAS, and FoxP3) and driver cytokines (TNF-α, IL-1B, and IL-17A) in lesional (red) and non-lesional (blue) skin between psoriasis without (No) and with (Yes) comorbidities (Psoriatic arthritis (a), Obesity (b)). The data include total study population of Asian small, Asian intermediate, and Western large psoriasis. Gene expression: Log2 conversion of mRNA expression normalized to human acidic ribosomal protein.

