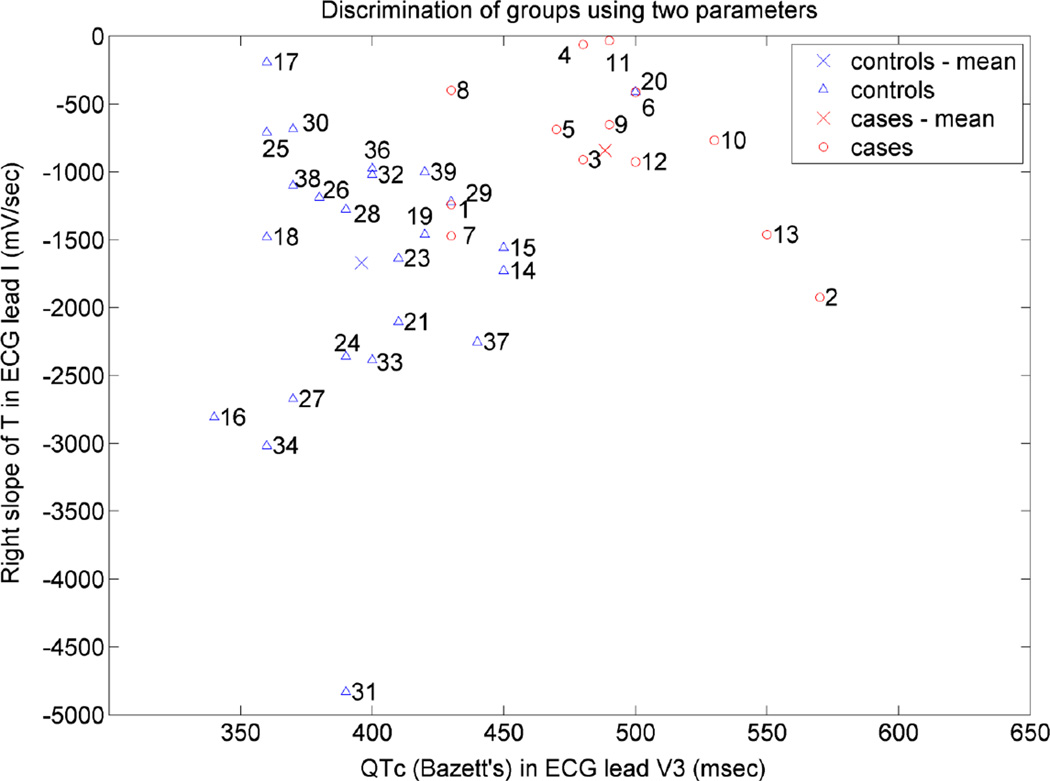
Figure 1.
ROC classification of the ECG features
A. ROC curve for QTc, AUC= 0.8096
B. ROC curve for T wave right slope. AUC =0.6442
C. ROC curve for QTc and T wave right slope. AUC =0.8750
Comparison of mean values of Lead V3 - QTc and Lead I - T wave right slope, cases vs controls. This is data analysed from the ECG closest to the Tdp event (case) or dismissal (control)


