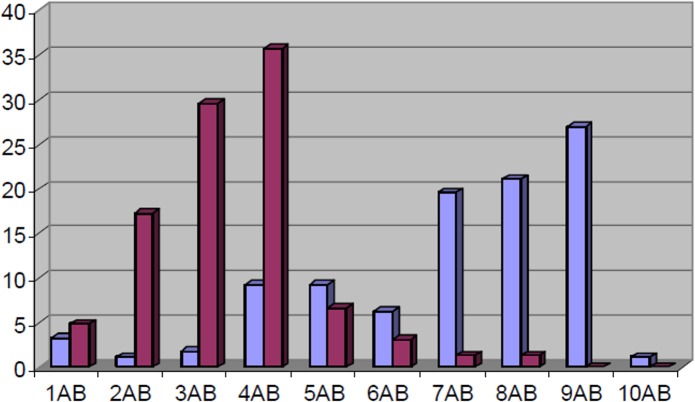
Fig 2. Dynamical distribution of multi-resistance in veal calves.
Proportion of strains (Y-axis, %) resistant for indicated number of antibiotics (X-axis: 1AB; resistance to 1 agent tested, 2AB; resistance to 2 agents tested, etc.) of faecal E. coli (N = 506) retrieved during the production cycles at T1 (blue bars; 4 weeks +- 5 days after arrival, N = 276) and T2 (red bars; 24 weeks +- 5 days after arrival, N = 230) from 5 veal calves farms.

