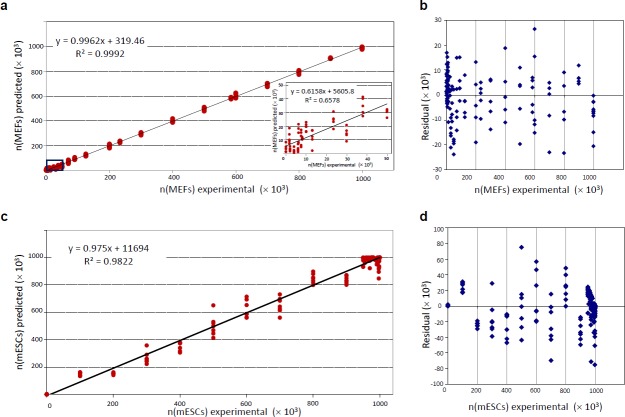
Fig 4.
(A) Correlation between ANN-predicted number of cells and the experimental number of MEFs in two-component mixtures of hESCs + MEFs. The inset shows the correlation between experimental and predicted values in low concentration ranges of MEFs up to the 50×103 cells in the two-component mixtures. (B) Overview of Residuals (difference between ANN-predicted number of cells and the experimental values) versus the experimental number of MEF cells in two-component mixtures of hESCs + MEFs. (C) Correlation between ANN-predicted number of cells and the experimental number of mESCs in two-component mixtures of hESCs + mESCs. (D) Overview of Residuals (difference between ANN-predicted number of cells and the experimental values) versus the experimental number of mESC cells in the two-component mixtures of hESCs + mESCs.

