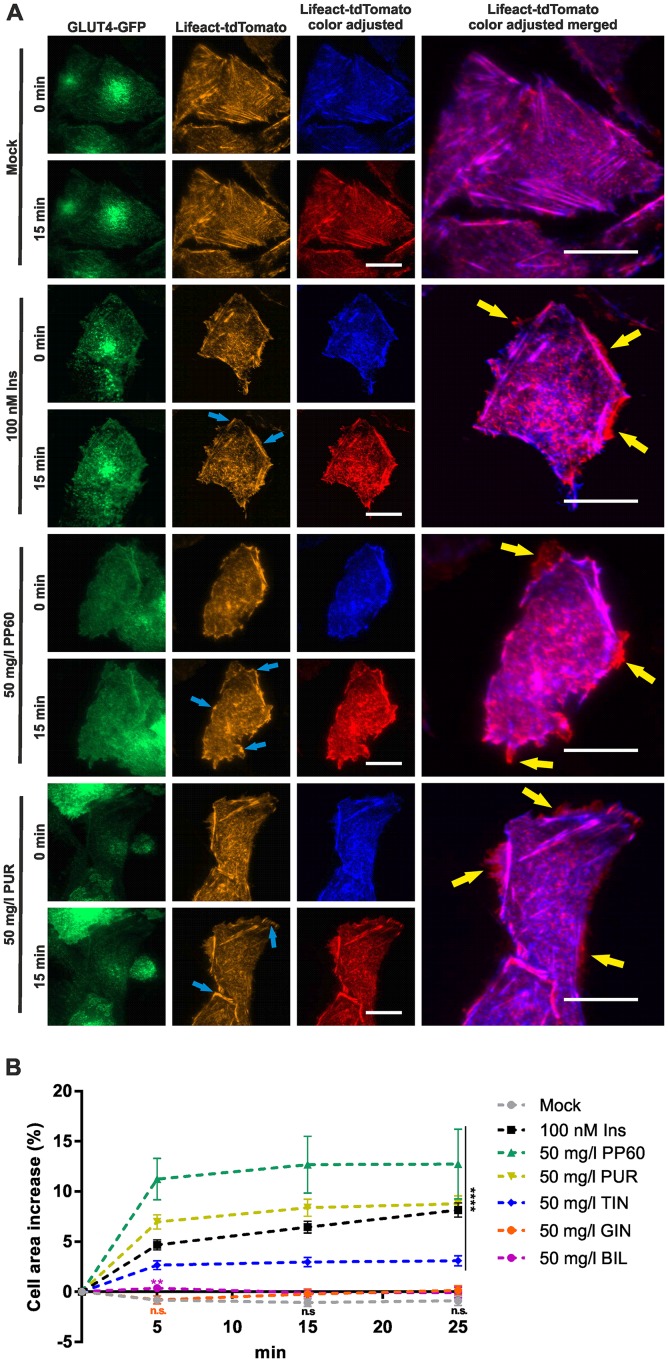
Fig 5. Effects of herbal compounds on actin remodeling.
CHO-K1 hIR/GLUT4-myc-GFP cells were transiently transfected with the F-actin marker Lifeact-tdTomato, seeded in 96-well plates (100,000 cells/well), grown over night, and then starved for 3 hours in HBSS buffer. (A) GLUT4-GFP and Lifeact-tdTomato signals recorded at 488 and 561 nm before and after stimulation (15 minutes). For a better visualization of changes in cell size upon compound treatment, additional color adjustment (blue and red images, respectively) of the Lifeact-tdTomato channel is shown. Signal oscillations and sustained intensity increases in the cell periphery are marked by blue arrows, while changes in cell size are indicated by yellow arrows. Scale bar = 20 μm. (B) Quantitation of compound induced change of cell size. Fluorescence images in the Lifeact-tdTomato channel (561 nm excitation) were recorded before and after (5, 15, and 25 minutes, respectively) compound treatment. Size of individual cells was quantitated (n > 30) at the different time points. Error bars are based on the standard error of the mean. **P < 0.01 and ****P < 0.0001, significant increase with respect to mock control.

