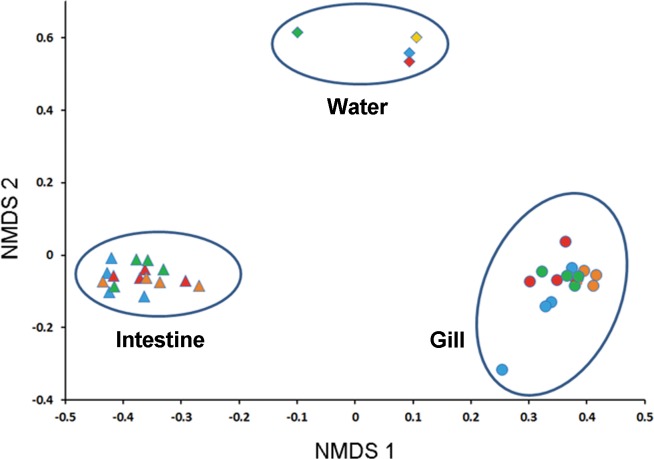
Fig 2. NMDS plot showing microbial community differences in water, gills and guts.
The distances were determined using the Bray-Curtis method with relative abundance of OTUs. Green represents samples from site T, yellow samples from site S, blue samples from Y, and red samples from C. Diamonds indicate samples from water, triangles samples from gut, and circles samples from gills.

