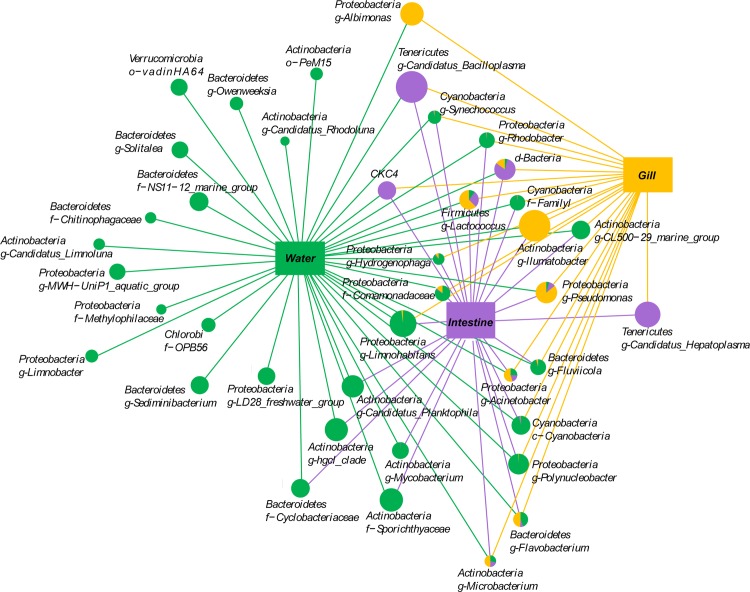
Fig 4. Network analysis visualizing the unique and shared bacterial groups in guts and gills of Chinese mitten crab and in the water in which they live.
Node sizes correspond to the mean relative abundance of each bacterial group. The proportion of shared bacteria is represented by the different colors in the pie charts; if the proportion of the bacterial group is <0.1% in gill, gut or water, these bacterial groups are shown with a line only.

