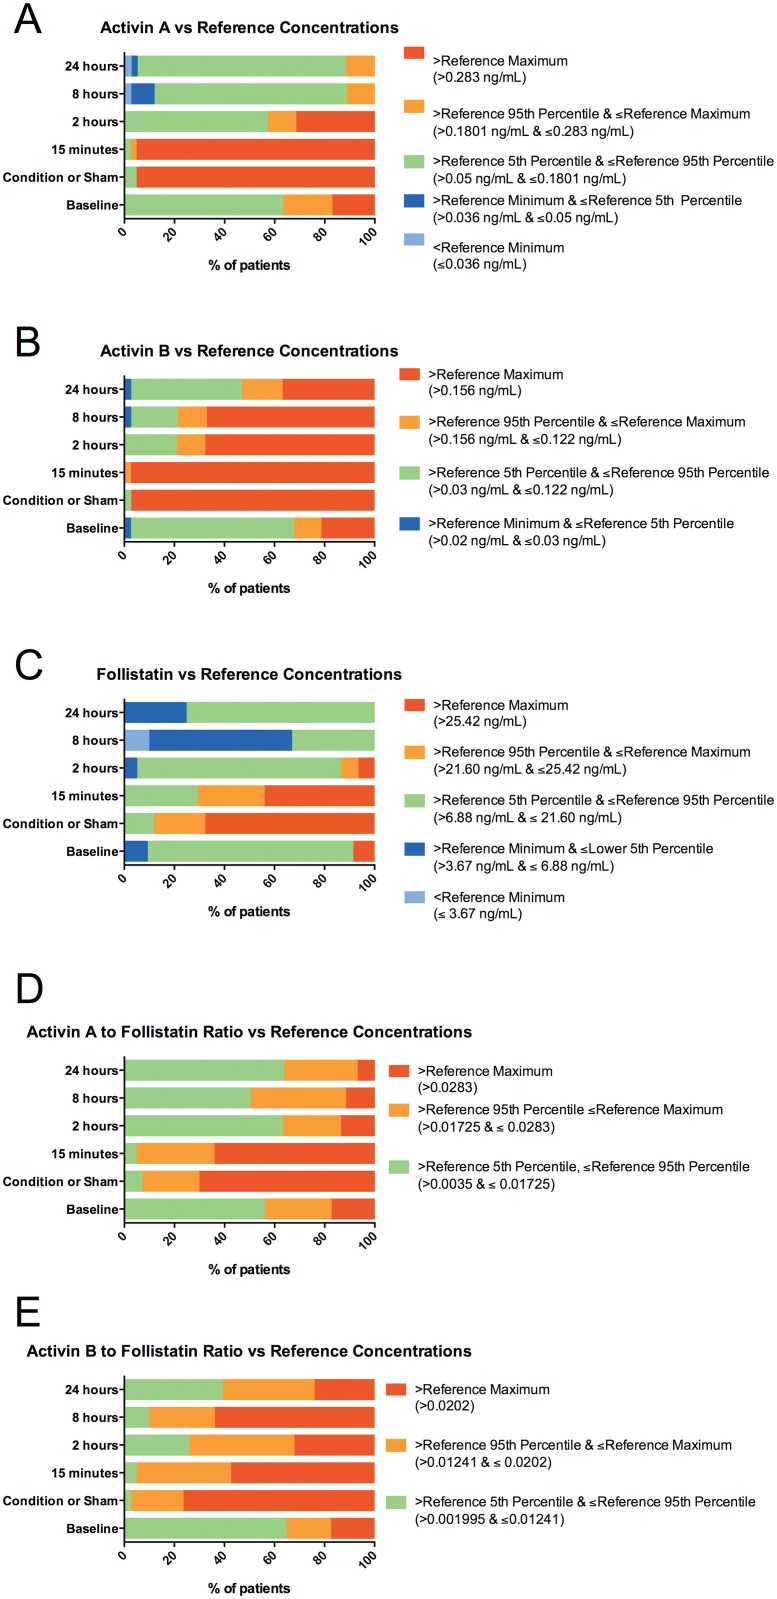
Fig 1.
(A) Serum activin A levels for the patients are illustrated and compared to the upper and lower reference thresholds for normal healthy volunteers (25). (B) Serum activin B levels for the patients are illustrated and compared to the upper and lower reference thresholds for normal healthy volunteers (25). (C) Serum follistatin levels for the patients are illustrated and compared to the upper and lower reference thresholds for normal healthy volunteers (25). (D) Serum Activin A to follistatin ratios for the patients are compared with the upper and lower reference ratio thresholds for normal healthy volunteers (25). (E) Serum Activin B to follistatin ratios for the patients are compared with the upper and lower reference ratios for normal healthy volunteers (25).

