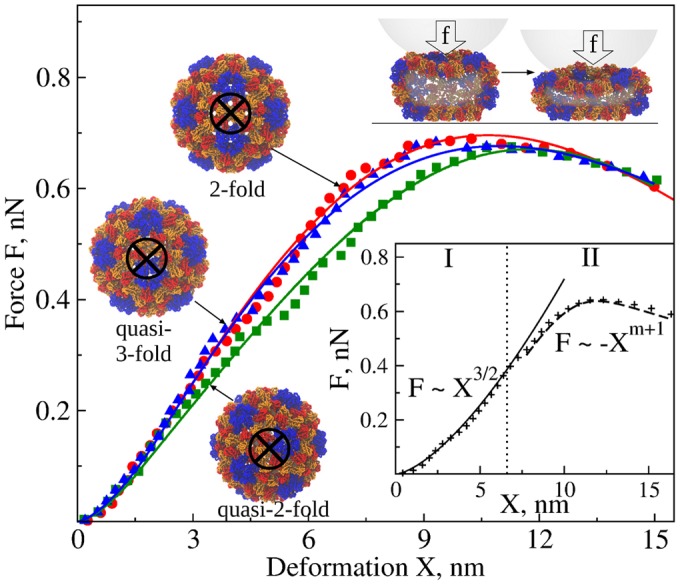
Fig 4. Compressive force-induced deformation of CCMV shell in silico.

The average simulated FX-spectra (data points), obtained from nanoindentations in silico (ν f = 1.0 μm/s, R tip = 20 nm, and κ = 0.05 N/m; S3a Fig) along the 2-fold (red), quasi-3-fold (blue), and quasi-2-fold (green) symmetry axes, are compared with the theoretical FX-curves obtained using the FNS model (solid lines). Snapshots on the left show the native CCMV structure in the intact state; the circled bolded X shows the locations of force application. We used MD simulations accelerated on GPUs [24, 25] and nanoindentations in silico to generate the average FX-spectra for the CCMV capsid (see also S1, S2, and S6 Figs). Computer simulation data are taken from Ref. [15]. Structures above the force maxima depict the capsid transitioning from the state right before the collapse (left) to the collapsed state (right). The inset shows a schematic for piece-wise spectrum modeling: in regime I, X≈x H, and F(X)≈F H; in regime II, X = x H+x b and F(X) = F H+F b.
