
Figure 2.
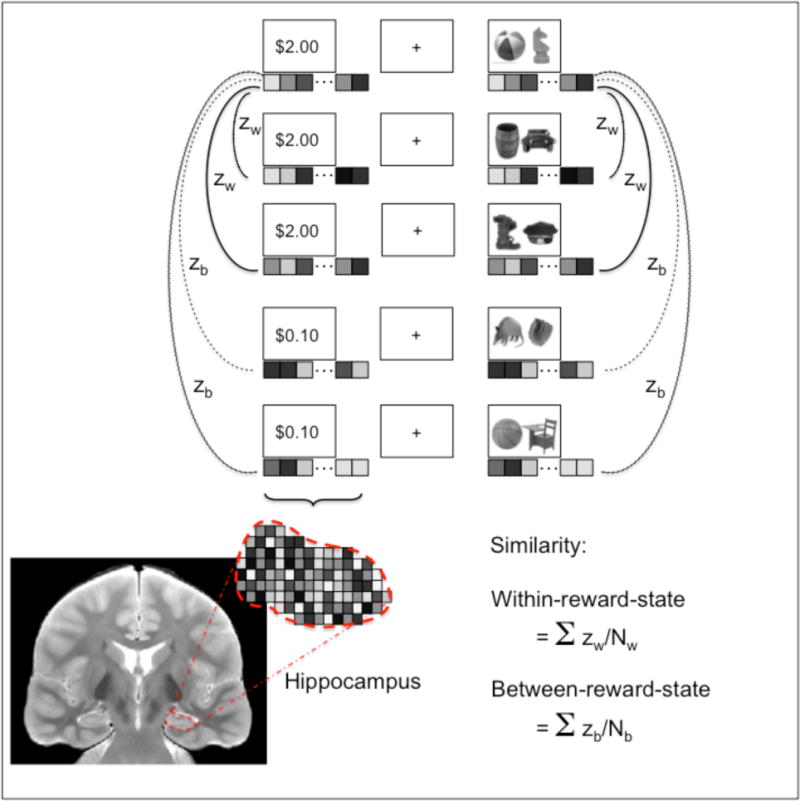
Representational similarity analysis strategy. For each cue and stimulus event within a trial, within-reward-state similarity was computed as the mean of the correlation between the activation pattern for that event and all other events of the same reward value in the functional run. Between-reward-state similarity was computed as the mean correlation between the activation pattern for that event and all events of different reward value in the functional run.