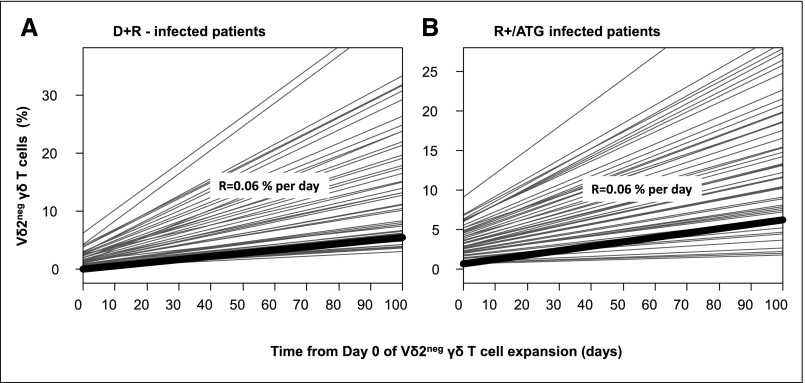
Figure 2.
Estimation of Vδ2neg γδ T cell expansion rate using a linear mixed model in D+R− infected patients (A) and in R+/ATG infected patients (B). Each infected patient had a growing phase of Vδ2neg γδ T cells identified by careful individual examination of the whole kinetics of Vδ2neg γδ T cells. The rate of expansion (R) was determined, patient by patient, during this growing phase. (A) Represents the estimation of expansion rate in D+R− infected patient. (B) Represents the estimation of expansion rate in R+/ATG infected patients.

