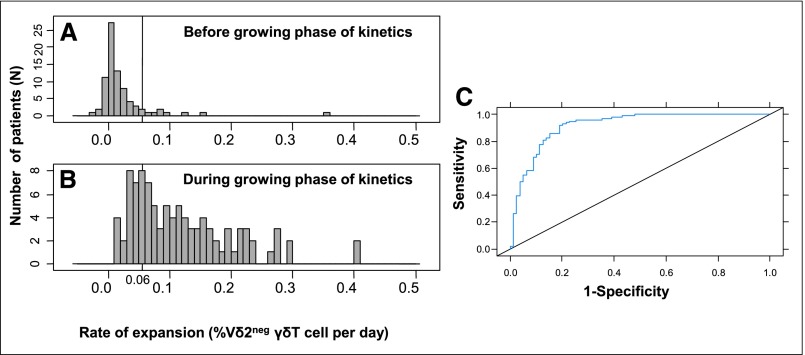
Figure 3.
Estimation of the threshold of Vδ2neg γδ T cell expansion rate. A represents a histogram of maximal Vδ2neg γδ T cell increase (in percentage of Vδ2neg γδ T cells per day) between two determinations before the growing phase of Vδ2neg γδ T cells kinetics. B represents a histogram of estimated Vδ2neg γδ T cell expansion rates (in percentages of Vδ2neg γδ T cells per day) with the linear mixed model during the growing phase of Vδ2neg γδ T cells kinetics. A rate of expansion of 0.06% per day was the best threshold to maximize the validity of the definition of the growing phase of Vδ2neg γδ T cells kinetics. (C) Receiver operating characteristics curve of estimated Vδ2neg γδ T cell expansion rates during the growing phase of Vδ2neg γδ T cells kinetics versus maximal Vδ2neg γδ T cell increases between two determinations before this growing phase. Thus, for a given infected patient, an increase of Vδ2neg γδ T cells >0.06% per day between two successive determinations predicted the growing phase, with Se of 77%, Spe of 90%, PPV of 88%, and NPV of 75% (AUC=0.91).

