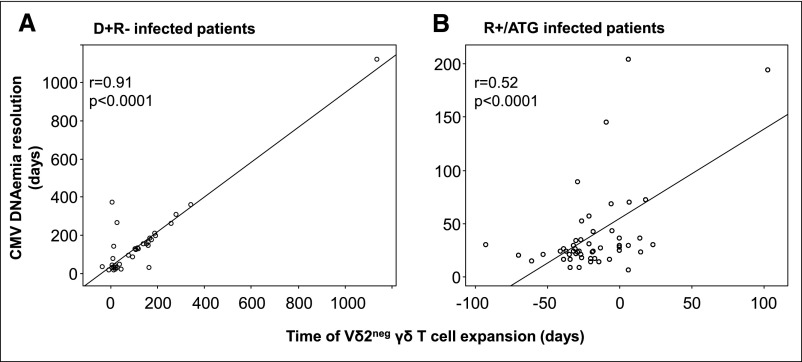
Figure 4.
Time of Vδ2neg γδ T cell expansion is correlated with the CMV DNAemia resolution. In (A) D+R− infected and (B) R+/ATG infected patients, linear regressions are represented between the CMV DNAemia resolution (days) and the time of Vδ2neg γδ T cell expansion (days). Scales are different between A and B with regards to the longer CMV DNAemia duration and the Vδ2neg γδ T cell expansion in D+R− compared with R+/ATG patients. P values were obtained using the Fisher test.

