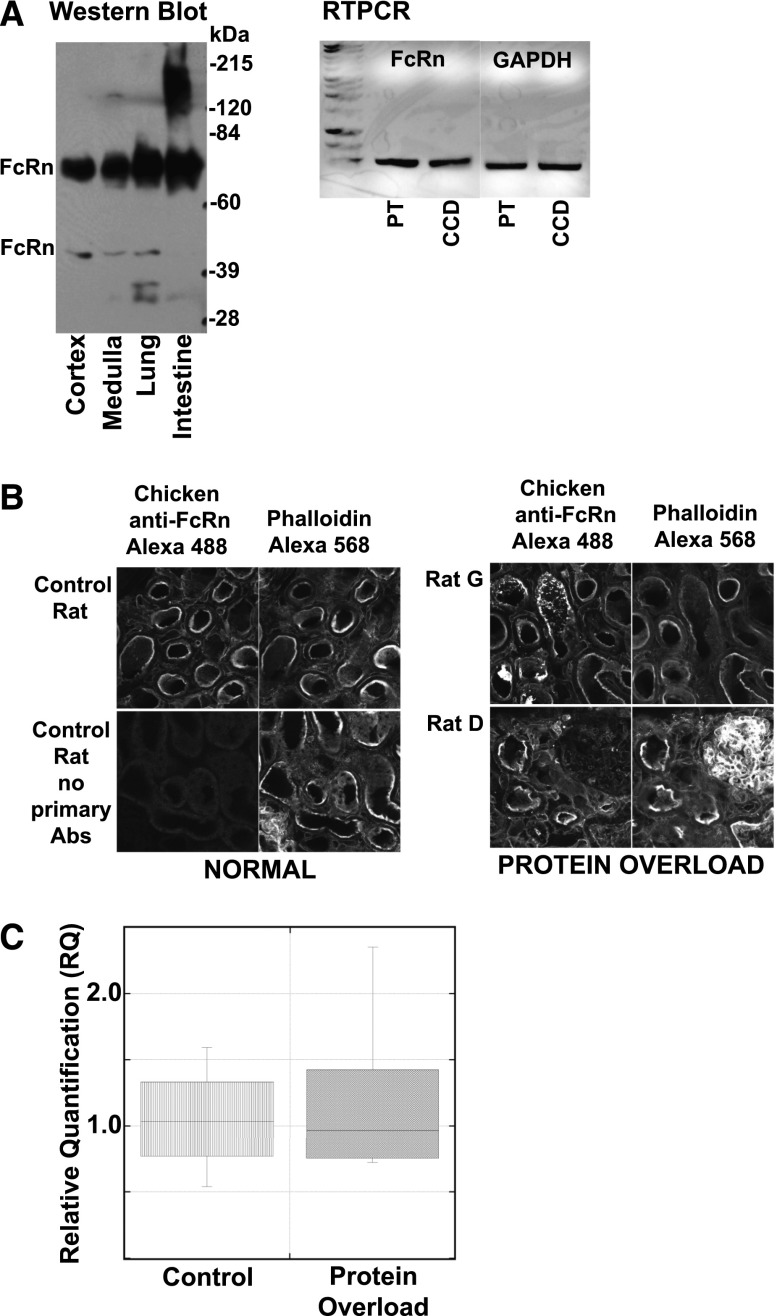
Figure 4.
FcRn location and levels do not correlate with protein overload changes. (A) Western blot of rat tissue (left panel) (kidney cortex, kidney medulla, lung and intestine) with equal amounts of proteins loaded on gel show FcRn is present in both kidney regions. Note, the upper FcRn band corresponds to the mature glycosylated form while the lower band is the immature form.19,20 In the right panel, RNA from micro-dissected PT and CCD, kindly provided by Dr. Lisa Satlin, were analyzed using RTPCR for FcRn and GAPDH. This also supports the presence of FcRn in both tubule segments. (B) Immunofluorescent localization of FcRn in control and protein overload (rats G and D) rat kidney cortex. Each section was labeled with the chicken anti FcRn Ab and phalloidin. Sequential laser excitation of each dye prevented any fluorescent crosstalk. Presented images consist of <5 μm z projections showing the same field and planes for both labels. Note that no significant difference was observed following protein overload. (C) FcRn qPCR was performed on RNA isolated from control (n=4) and protein overloaded rats (n=6). Box plot of the RQ results showed no significant difference in expression levels for FcRn, control mean 1.05±0.43 and protein overload mean 1.20±0.63. GAPDH, glyceraldehyde-3-phosphate dehydrogenase; RQ, relative quantification.

