Figure 4.
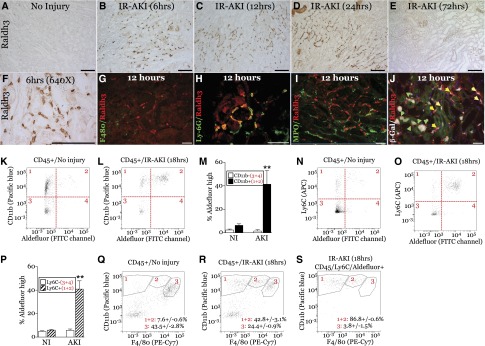
Raldh3 is expressed at sites of RA signaling at early time points after IR-AKI. Unilateral IR-AKI was performed in wild-type BALB/c or RARE-hsp68-LacZ mice, and kidneys harvested at the indicated times after injury. (A–F) Localization of Raldh3 expression in the OM at 0, 6, 12, 24, and 72 hours in the OM after IR-AKI. Kidney sections stained with anti-Raldh3 antibody, detected using horse radish peroxidase/3,3ʹ-diaminobenzidine substrate, counterstained with hematoxylin. (A–E) Original magnification, ×200. (F) Original magnification, ×640. (G–J) Cellular localization of Raldh3 in the OM after IR-AKI. Co-staining Raldh3 (red) with (G) macrophage/dendritic cells marker, F4/80 (green), (H) neutrophil and early infiltrating macrophage marker, Ly-6G (green), and (I) neutrophil marker, myeloperoxidase (green). (J) Co-localization of Raldh3 expression and RA signaling 12 hours after IR-AKI. β-Gal activity was detected in RARE-hsp68-LacZ reporter mice, and sections stained with Raldh3 antibodies (red). β-Gal pseudocolored in white, green autofluorescence shows renal tubular structures. Green arrows indicate Raldh3-positive cells surrounding β-Gal–positive renal tubular cells; yellow arrows indicate Raldh3-expressing cells that are also β-Gal–positive. White scale bars, 50 mm, black bars, 100 mm. (K–S) FACS analysis of ALDH activity in CD45+ renal leukocytes using the ALDEFLUOR reagent. (K–M) CD11b and ALDEFLUOR fluorescence in uninjured and injured kidney. (K and L) Representative dot plots indicating CD11b and ALDEFLUOR high and low quadrant gates. (M) Quantification of ALDEFLUOR high CD11b + and – cells. (N–P) Ly6C and ALDEFLUOR fluorescence in uninjured and injured kidney. (N and O) Representative dot plots indicating Ly6C and ALDEFLUOR high and low quadrant gates. (P) Quantification of ALDEFLUOR high Ly6C + and – cells. (Q and R) Representative dot plots of F4/80 and CD11b fluorescence in uninjured and injured kidneys. Gating for F4/80- (1), F4/80 low (2) and F4/80 high (3) indicated and quantified. (S) Representative dot plots of F4/80 and CD11b fluorescence in Ly6C/ALDEFLUOR high cells (gate 2 in O) in injured kidneys. Results expressed as mean±SEM % of total gated cells (CD45+ or CD45/Ly6C/ALDEFLUOR high cells, as indicated). n=3 mice per condition. (N and Q) t Test comparing CD11b+ or Ly6C+ cells from uninjured versus injured kidneys, **P<0.01.

